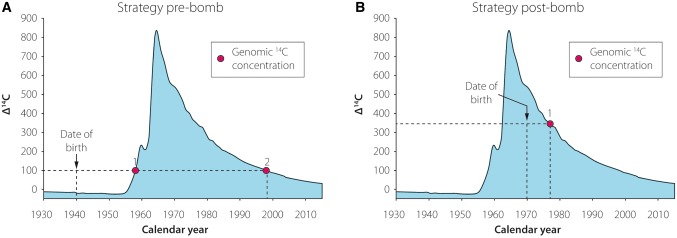
Figure 2.
Strategy for radiocarbon (14C) birth dating of distinct cell populations. (A–B) 14C content in the genomic DNA of the cell population of interest is compared with the recorded atmospheric 14C levels, as shown by the blue graph. The date of birth of the studied individual is indicated by a vertical dashed bar, while the horizontal dashed line corresponds to the 14C value measured in the DNA samples. The age of the sampled cell population can be inferred from the intersection of the horizontal line and the atmospheric 14C curve. (A) Genomic 14C values gained from individuals born before the nuclear bomb tests correspond to two distinct time points (Points 1 and 2). Since the incorporation of environmental 14C might have occurred during the rise and/or the fall of the curve, the precise age of the cell population cannot be determined with certainty based exclusively on these results. (B) However, in individuals born after the nuclear tests, the measured 14C levels unambiguously determine the age of the cell population (Point 1).

