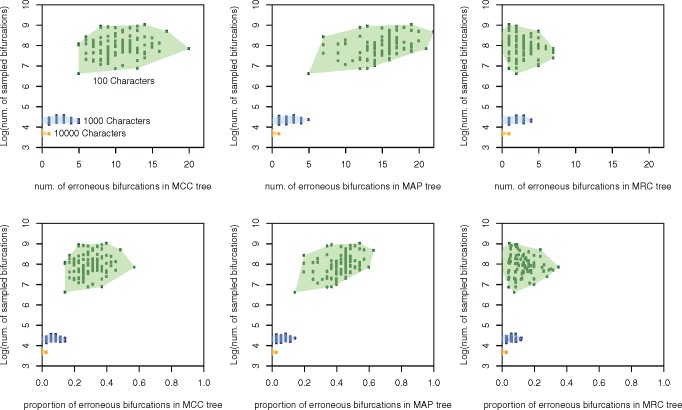
Figure 1.
The number and proportion of incorrect bifurcations in MCC, MAP, and MRC summarizations of simulated data sets of different sizes plotted against the number of unique bifurcations sampled in each analysis. MRC trees present fewer incorrect nodes in both absolute and proportional terms, with MCC presenting fewer incorrect nodes than MAP trees. When few characters are analyzed there are more incorrect nodes, in both absolute and proportional terms, in MCC trees than MAP trees. When more characters are analyzed the performance of all three consensus tree methods begins to converge.

