
Figure 8.
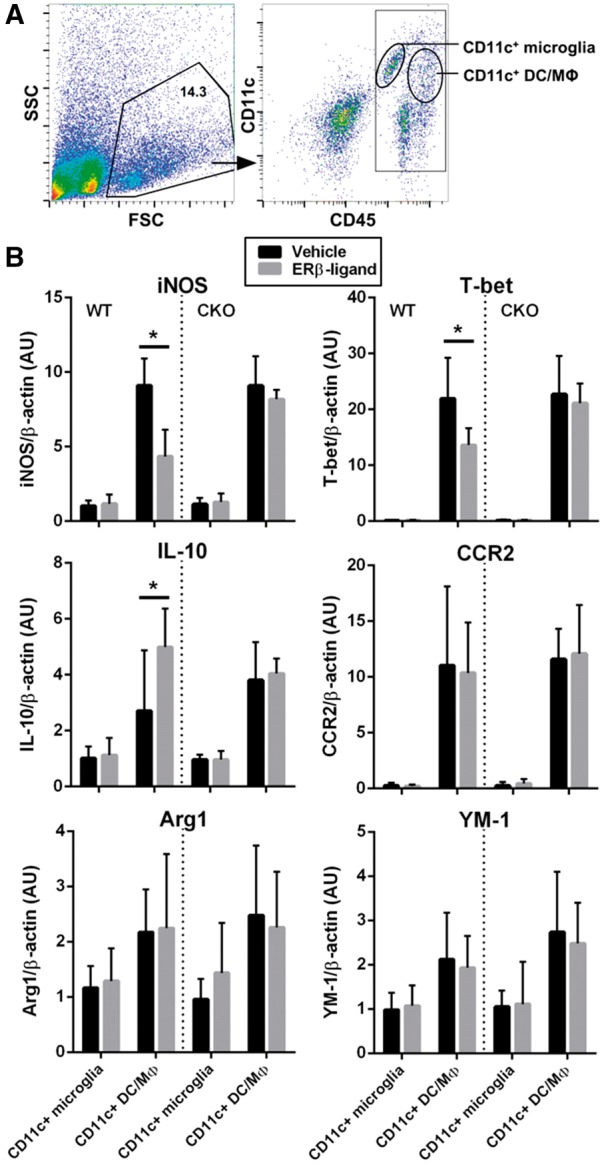
Gene expression profiles of CD11c+ microglia and CD11c+ dendritic cells and macrophages cells from the CNS of ERβ-ligand or vehicle treated mice with EAE. (A) Representative flow cytometry plots of isolated CNS mononuclear immune cells from a pool of two to four individual mice. CNS mononuclear immune cells were gated based on SSC and FSC (left), and subpopulations were identified using CD11c and CD45 staining (right). Cell populations labelled as CD11c+ microglia and CD11c+ myeloid dendritic cells and macrophages were FACS sorted for mRNA isolation and quantitative PCR analysis. (B) Quantitative analysis of iNOS, T-bet, IL-10, CCR2, ARG1, and YM-1 mRNA expression levels of sorted CD11c+ microglia and CD11c+ myeloid dendritic cells and macrophages from wild type (WT) (left) and CD11c ERβ CKO (right) mice with EAE that were treated with vehicle or ERβ-ligand. Data are from three separate experiments, with error bar representing variation between experiments. *P < 0.05.