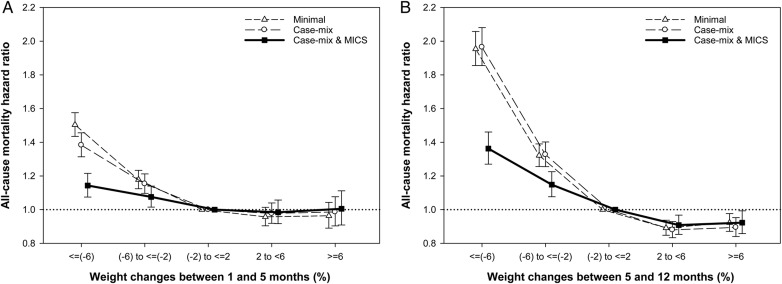
FIGURE 3.
Association of percent changes in body weight with all-cause mortality (hazard ratios and 95% confidence interval error bars). (A) Weight changes between 1 and 5 months. (B) Weight changes between 5 and 12 months. MICS, malnutrition-inflammation-cachexia syndrome. Models adjusted for case–mix covariates and markers of malnutrition and inflammation (see text for covariate list).

