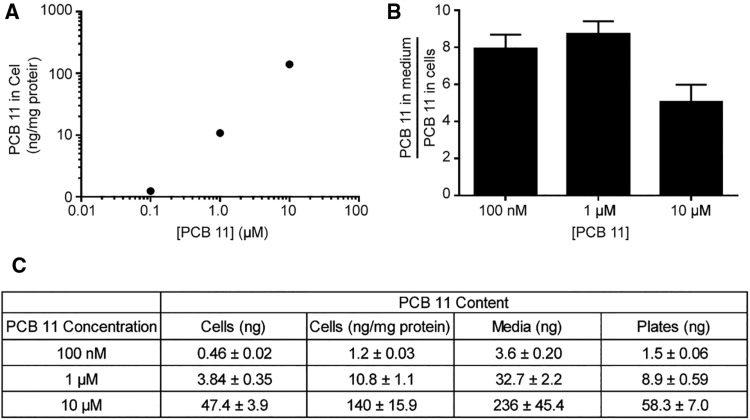
Figure 8.
Quantification of PCB 11 in cell cultures. PCB 11 was quantified in the culture media, cell pellets, and the plastic plates from primary cortical cell cultures at DIV 9 after 48 h exposure to varying concentrations of PCB 11. (A) Amount of PCB 11 in the cellular fraction after exposure to PCB 11 at varying concentrations in the cell medium. (B) Ratio of PCB 11 concentration in the medium to cell pellet. (C) PCB 11 content in the cell pellets, cell media and plates of cultures exposed to varying concentrations of PCB 11 in the medium. Data are presented as mean ± SE (n = 6 separate wells from 2 independent dissections).

