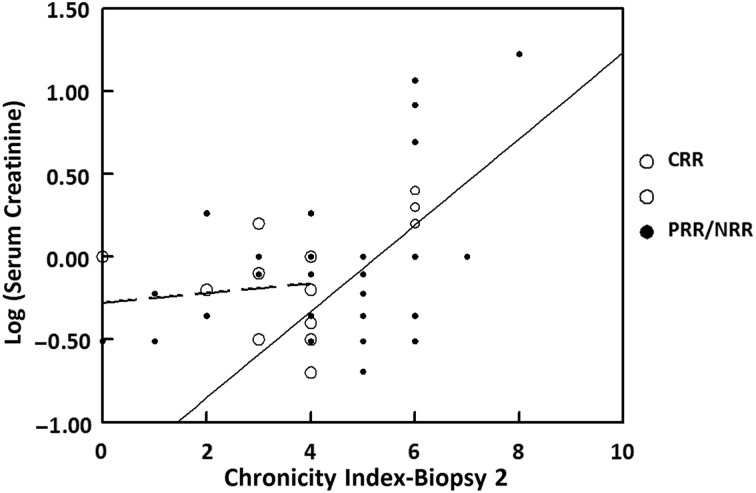
FIGURE 4.
Serum creatinine as a function of renal CI on biopsies taken after completion of induction therapy. Each circle represents an individual patient. Patients who achieved a complete renal response after induction therapy (CRR) are represented by open circles; patients who did not achieve a complete renal response after induction therapy (PRR/NRR) are represented by closed circles. The segmented linear regression lines are for CI <4 (broken line) and CI ≥4 (solid line). The regression equation for CI <4 is log(SCr) = −0.278 + 0.029 × CI2 (r = 0.12, P = 0.66). The equation for CI ≥4 is log(SCr) = −1.37 + 0.26 × CI2 (r = 0.6, P < 0.0001).

