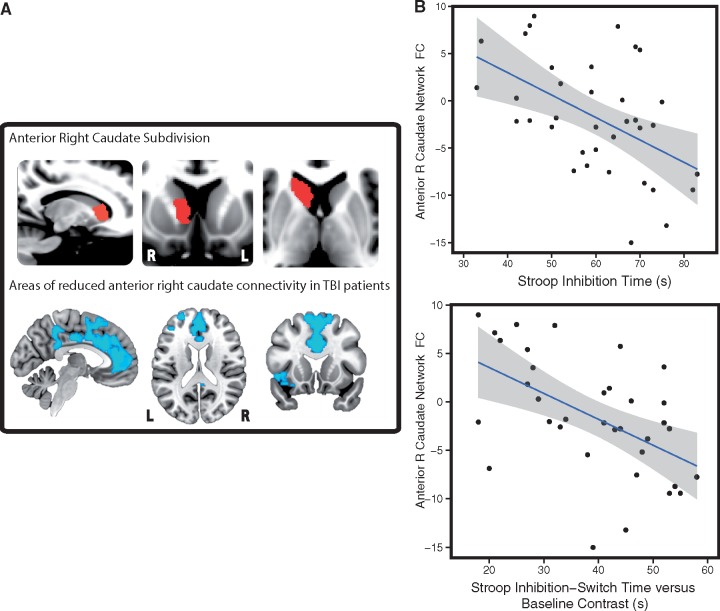
Figure 4.
The relationship between corticostriatal functional connectivity and neuropsychological measures. (A) The anterior right caudate subdivision (top) and associated reductions in functional connectivity (FC) in TBI patients. The functional connectivity map is thresholded at P < 0.05, FWE corrected for multiple comparisons. (B) Graphs representing significant correlations (P < 0.01, FDR corrected) between right anterior caudate functional connectivity and performance on the Stroop task, including measures of executive function corrected for baseline speed. Reduced functional connectivity was correlated with slower reactions times. Areas highlighted in grey correspond to the 95% confidence intervals. L = left; R = right.

