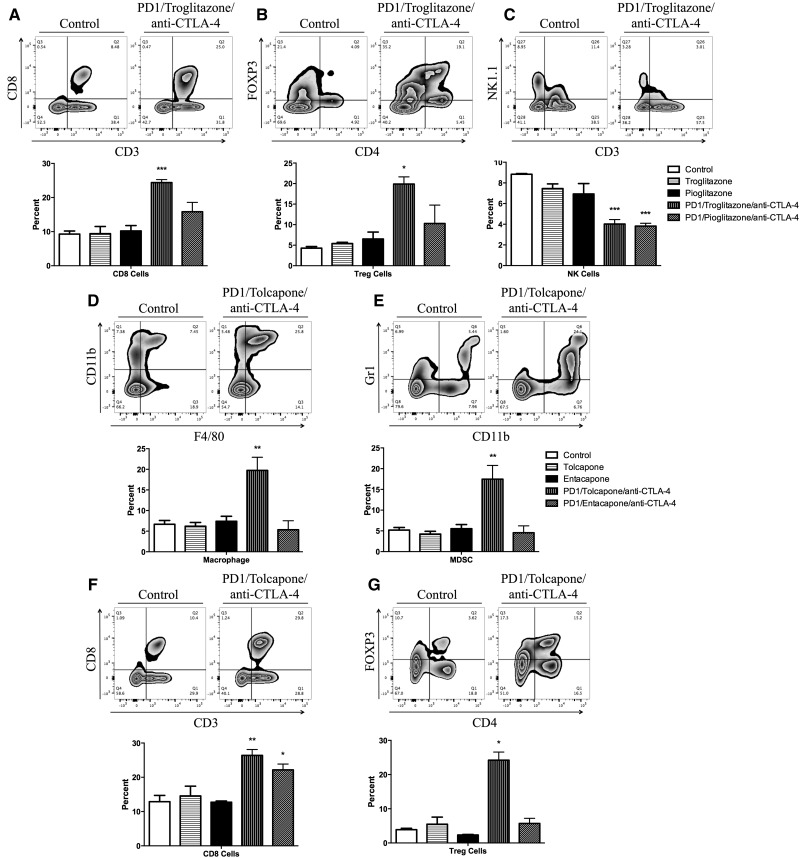
Figure 3.
Flow cytometry analysis of mononuclear leukocytes in the liver. A representative zebra plot and the average of 3 animals is displayed. Mononuclear cells with significant differences among the treatment groups compared with control are displayed (when the difference was not significant the data are not shown). (A) CD8 T cells; (B) Treg cells; (C) NK Cells. Control, Control C57BL/6 mice; Troglitazone, C57BL/6 mice treated with troglitazone only; Pioglitazone, C57BL/6 mice treated with pioglitazone only; PD1/Troglitazone/anti-CTLA-4, PD1−/− mice treated with troglitazone and anti-CTLA-4; PD1/Pioglitazone/anti-CTLA-4, PD1−/− mice treated with pioglitazone and anti-CTLA-4. (D) Macrophages; (E) MDSCs; (F) CD8 T cells; (G) Treg cells. Control, Control C57BL/6 mice; Tolcapone, C57BL/6 mice treated with tolcapone only (n = 3); Entacapone, C57BL/6 mice treated with entacapone only; PD1/Tolcapone/anti-CTLA-4, PD1−/− mice treated with tolcapone and anti-CTLA-4; and PD1/Entacapone/anti-CTLA-4, PD1−/− mice treated with entacapone and anti-CTLA-4. Values represent the mean ± SE. Analyzed for statistical significance by 1-way ANOVA. p < .05 was considered significant (*p < .05; **p < .01; ***p < .001).

