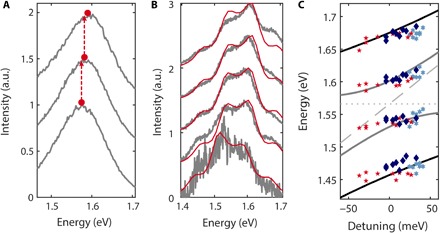
Fig. 3. QD detuning at high excitation rates.

(A) Fluorescence spectra of uncoupled QDs. With increasing excitation rate (bottom to top), the peak intensity indicates a blue shift. (B) Spectra for increasing pump rate (gray lines, bottom to top) overlaid with calculated spectra (solid lines) for different detunings. (C) Peak positions for a range of detunings induced by different excitation rates of three different QDs. The Rabi peak positions of the neutral (charged) QD state based on the quantum model are indicated by the solid black (gray) lines. The gray dashed (dotted) line indicates the QD (PNR) resonance.
