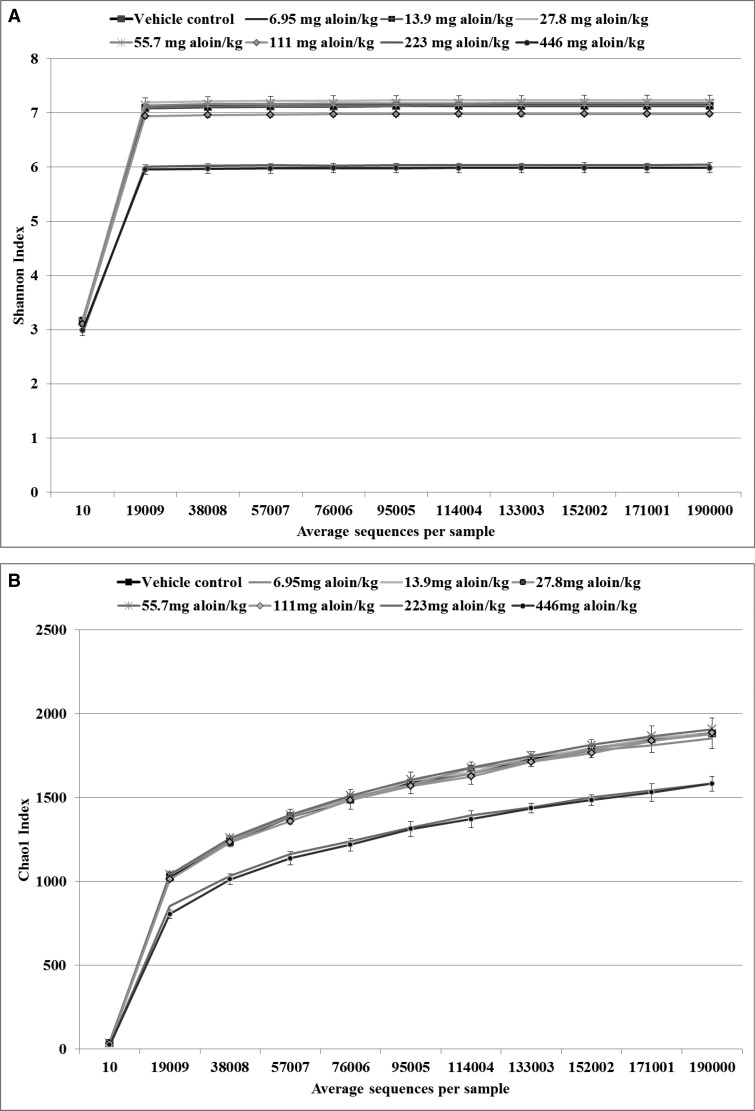
Figure 4.
Alpha diversity curves. The rarefaction table that was generated in Qiime was used to generate the alpha diversity curves. The diversity metrics reflect the diversity within a sample based on the abundance of various phylotypes within a bacterial community. A, Shannon phylotypes diversity curves by sequences per treatment (n = 5). B, Chao1phylotype richness curves by sequences per treatment (n = 5). Data suggest that the fecal microbiota profile in F-344 rats was considerable altered as a consequence of aloin treatment; fecal content richness and diversity were lower in rats administered aloin in the drinking water at doses of 223 and 446 mg/kg water.

