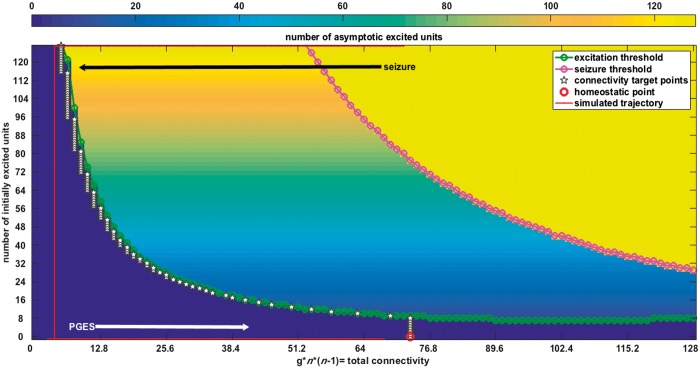
Figure 2.
Output from the computational model. Results from simulations of the system (Equation 1). The system output is generated for 129 values of the connectivity parameter g, ranging from 0 to 128 on the horizontal axis, and for 0 to 128 initially excited units, indicated on the vertical axis. The background colour represents the number of excited units that remain self-sustained according to the dynamics of the coupled system of oscillators. All simulations were first done without noisy input and without changes of the connectivity parameter g. The blue region corresponds to a non-excitable state (‘postictal’); yellow to a limit cycle state (total synchronization or ‘seizure’); and the gradually coloured state in the middle, to ‘normal functioning’, where the system sustains its initial state. Introduction of noise and plasticity of connectivity g through the coherence detector (Equation 2), makes the system transition between the different states (red line). The model simulation starts in a ‘seizure’ state. The connectivity parameter g is activated above a certain level of synchrony (the input from the coherency detector from Fig. 1). This ‘seizure’-induced plasticity of the connectivity parameter g causes termination of the ‘seizure’ and drives the return through a ‘postictal’ period to the ‘normal’ state which we defined as an excitability threshold 50% higher than that of the homeostatic point, indicated in red.

