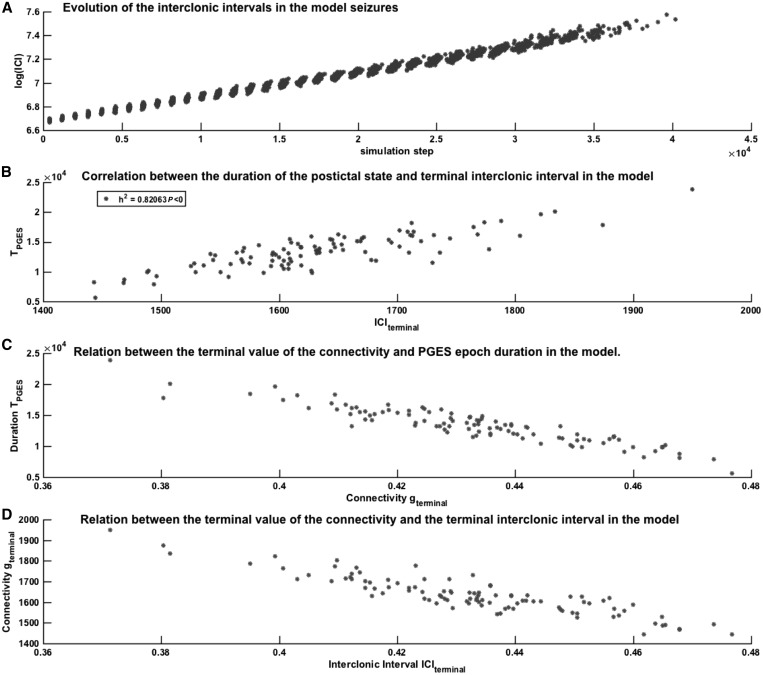
Figure 4.
Relation between the interclonic interval, connectivity and PGES in the model. (A) Scatter plot showing the relation between the ICI (vertical axis, logarithmic scale) determined by the strength of the connectivity parameter g during simulated seizures and the time elapsed since the beginning of the simulated seizure (horizontal axis, in simulation steps). The different data points at each time point represent different simulations. The figure shows that the interclonic interval is relatively constant at the start of the model seizure, but varies at the end of the seizure. (B) The relation between the model terminal interclonic interval (ICIterminal, horizontal axis) value and the duration of the PGES state in the model (vertical axis). The non-linear correlation coefficient h2 shows that the terminal interclonic interval value explains 82% of the variability of the PGES duration. (C) Scatter plot showing the relation between the durations of the simulated PGES states (vertical axis, in simulation steps) and the value of the connectivity parameter g at the end of the preceding seizure (horizontal axis, dimensionless units). (D) the relationship between the terminal value of the connectivity parameter g and the terminal interclonic interval in the model.

