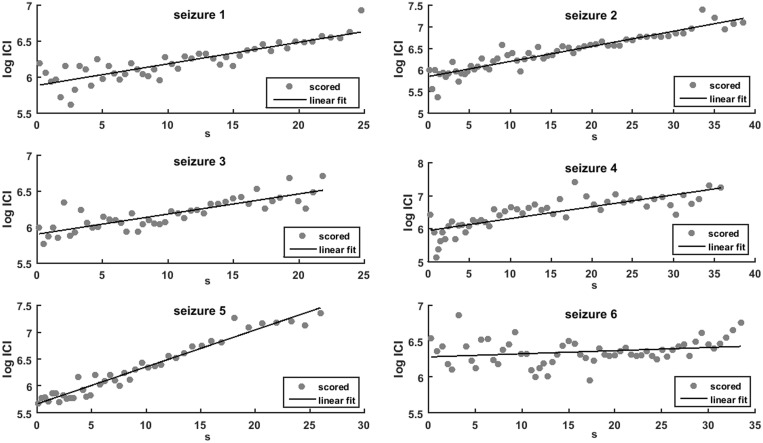
Figure 6.
Linear fit of the interclonic interval in human seizures. Scatter plots of interclonic intervals (circles) and best linear fit (solid line) between the time from the beginning of the convulsive phase (in seconds, horizontal axis) and the logarithm of the interclonic intervals [log(ICI), vertical axis]. The figure illustrates the six first seizures from the dataset, the fitting algorithm was applied to all 48 cases.

