Figure 2.

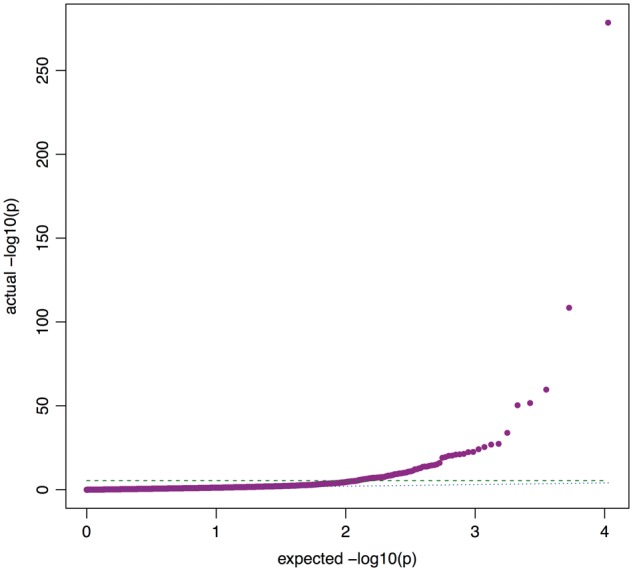
QQ plot of preliminary MR-pheWAS analysis seeking to identify the causal effects of BMI. Dashed line: Bonferroni corrected threshold P = 4.71 × 10⁻⁶ (P = 0.05 corrected for 10 624 tests). Dotted line: actual = expected.

QQ plot of preliminary MR-pheWAS analysis seeking to identify the causal effects of BMI. Dashed line: Bonferroni corrected threshold P = 4.71 × 10⁻⁶ (P = 0.05 corrected for 10 624 tests). Dotted line: actual = expected.