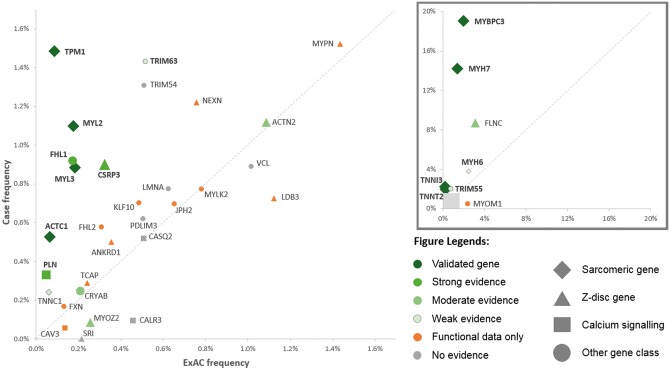
Figure 3.
Scatter plot summarizing the evidence for involvement of genes implicated in hypertrophic cardiomyopathy (low frequency genes in main plot, higher frequency genes in subplot). The frequency of rare variants in combined cases is shown on the y-axis and in Exome Aggregation Consortium on the x-axis. Genes with an excess in cases are displayed above the diagonal. Data points are coloured according to classification by this study, shaped according to gene function and sized according to amount of published segregation data.

