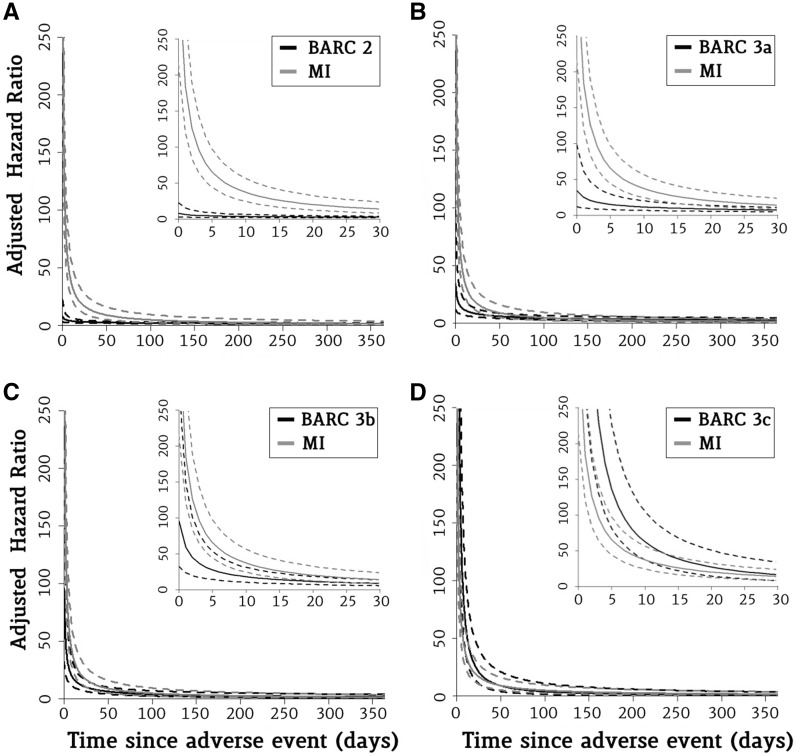
Figure 3.
Evolution of the prognostic impact of minor and major bleeding vs. myocardial infarction over time. This figure shows the adjusted hazard ratio for mortality of myocardial infarction vs. minor (BARC 2) and major (BARC 3a–c) bleeding as a function of time elapsed after the event. Inside graph: The decline in hazard ratio as an exponential function of time in the first 30 days. Outside graph: The decline in hazard ratio for the first year after the event. Solid lines represent point estimates; dashed lines represent 95% confidence intervals. MI, myocardial infarction; BARC, Bleeding Academic Research Consortium.

