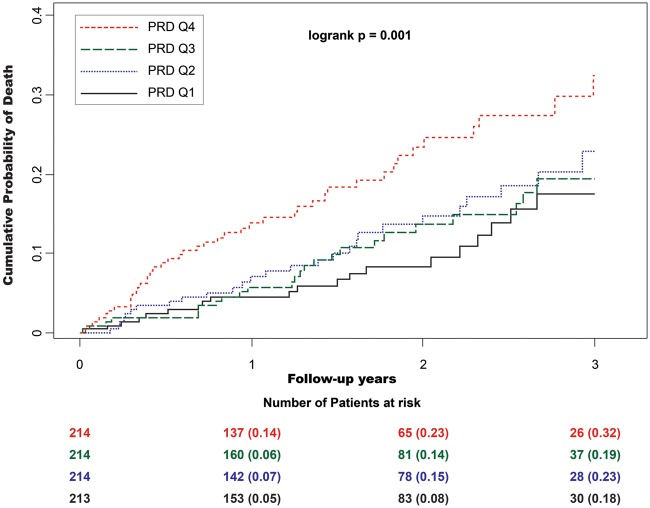
Figure 2.
Cumulative 3-year mortality rates in the MADIT-II population. Patients are stratified by PRD quartiles (PRD Q1 ≤4.09 deg2, PRD Q2 4.10–7.27 deg2, PRD Q3 7.28–11.51 deg2, PRD Q4 ≥11.52 deg2). Because of low number of patients with follow-up time greater than 3 years, Kaplan–Meier curves were right-censored at year 3.

