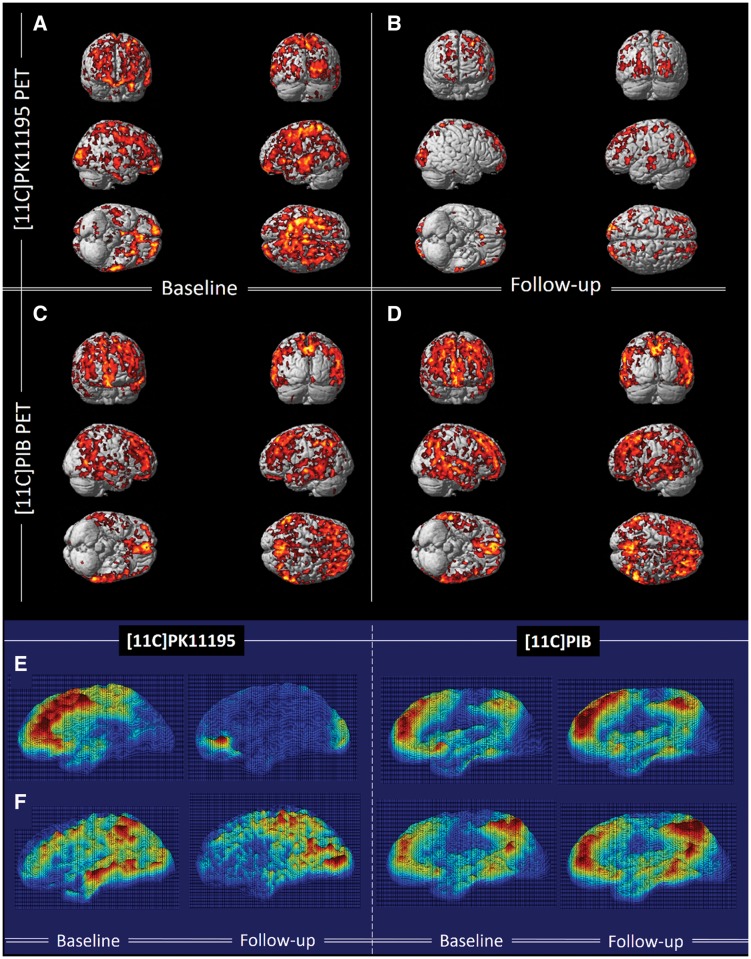
Figure 2.
Longitudinal changes in 11C-(R)PK11195 BP and 11C-PIB in subjects with MCI compared to controls at baseline and follow-up. (A and B) Clusters of significantly increased 11C-(R)PK11195 BP in subjects with MCI compared to healthy controls at baseline and follow-up, respectively, with the same voxel threshold of P < 0.01 and extent threshold of 50 voxels. (C and D) Clusters of significantly increased 11C-PIB in subjects with MCI compared to healthy controls at baseline and follow-up (P < 0.0001 and extent of 200 voxels). Supplementary Table 3 details the coordinates with their statistical results. (E and F) 3D intensity T-map of 11C-(R)PK11195 BP and 11C-PIB RATIO for two individual subjects with MCI at baseline and follow-up. The surface plot represents significant increase in the microglial activation (left) and amyloid deposition (right) against the control group at baseline superimposed on a 3D matrix at baseline and follow-up.

