Figure 1.
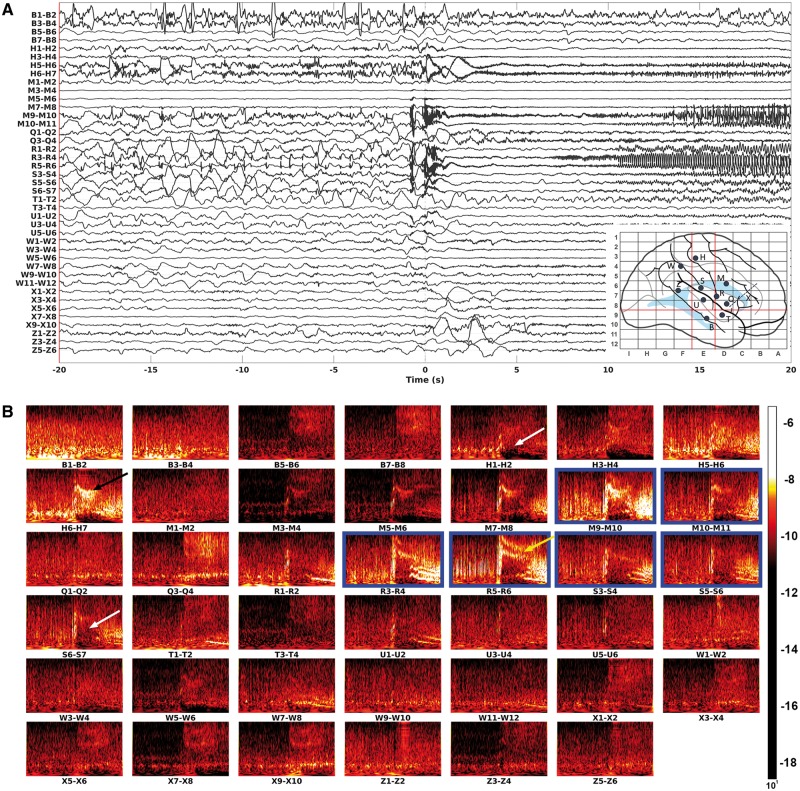
SEEG recording and time-frequency plots of seizure onset. (A) The SEEG time series. Bipolar montage was applied by taking the difference between signals from two adjacent contacts. Ictal onset is marked as ‘0’, full duration of the segment is 40 s (from −20 s to 20 s). (B) The Morlet time frequency maps corresponding to each bipolar contact pair in A. Each graph shows 20 s before the seizure onset to 20 s after the seizure onset, along the horizontal axis. The vertical axis represents frequencies from 1 Hz to 200 Hz, logarithmically spaced and spectrally flattened to emphasize the higher frequencies. Contacts in the resected area are outlined in blue. The pattern characterized by the combination of a spike, multiband fast activity and suppression is localized inside the resected area (yellow arrow), while broadband fast activity (black arrow) and suppression without sustained fast activity (white arrow) are localized outside the resected area.

