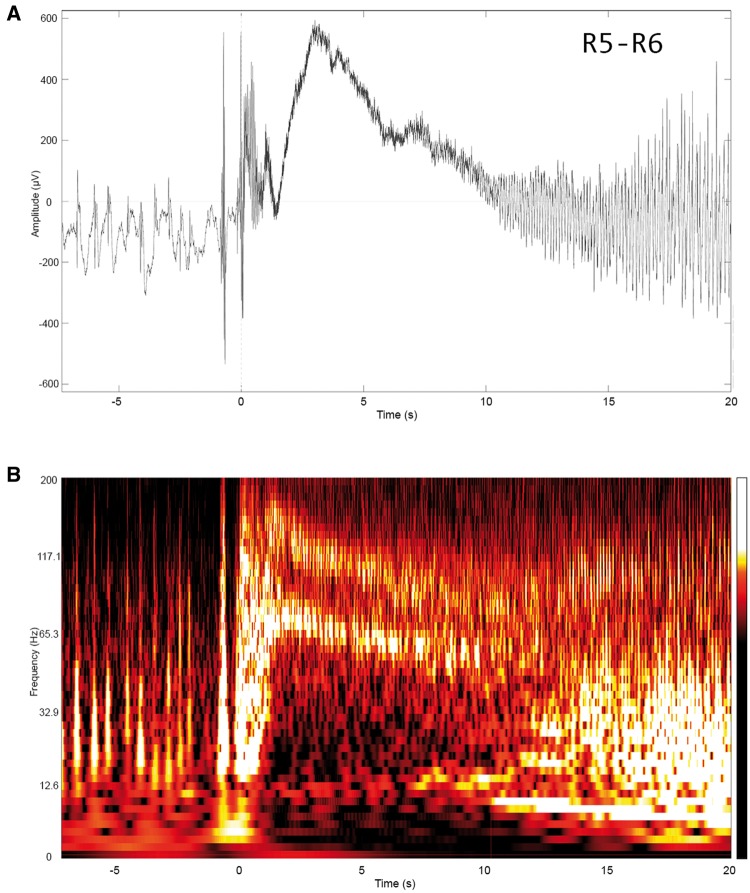
Figure 2.
Example of pre-ictal to ictal transitions in the epileptogenic zone. Channel R5-R6 from Fig. 1A from 5 s before to 20 s after the ictal onset is shown in (A) and the corresponding time frequency plot (logarithmic scale) is shown in B. The time frequency plot shows the proposed ‘fingerprint’: a combination of pre-ictal spikes, multi-band fast activity and simultaneous suppression of slower background frequencies. Note that fast activity is characterized by multiple bands that are not harmonically related, chirp at different frequency rates, and whose amplitudes vary independently across bands.

