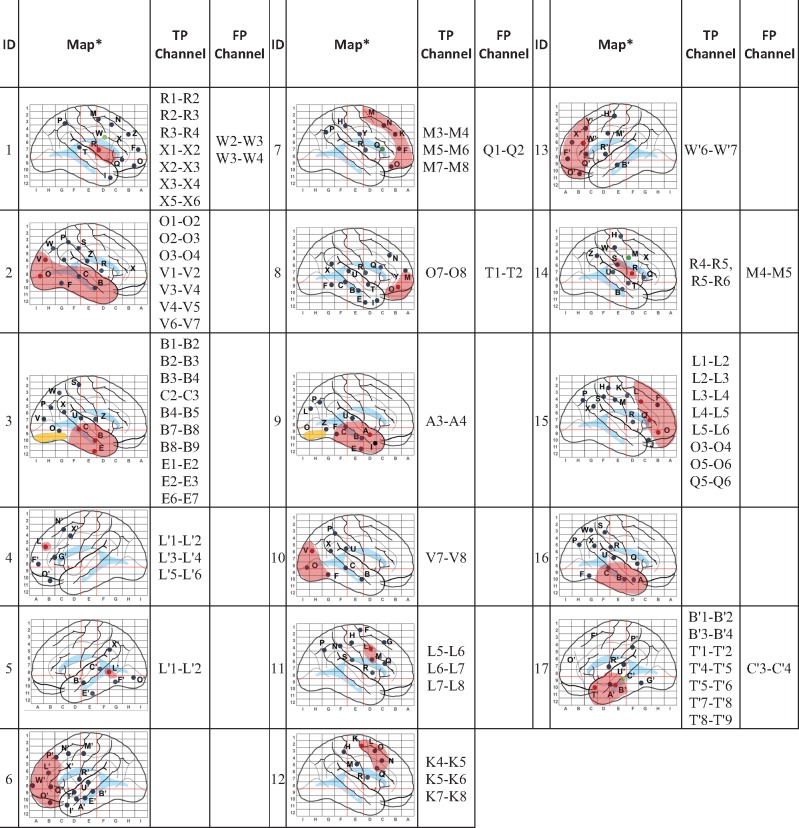
Figure 4.
Implantation maps with schematic representation of the resection margins (red) and bipolar SEEG channels identified by the algorithm as true positive (TP) and false positive (FP). *Electrodes on the maps are marked: (i) as red if they contain true positive (TP) channels (potentially epileptogenic inside the resection); (ii) as green if they contain false positive (FP) channels (potentially epileptogenic outside the resection); (iii) as black if they contain only true negative (TN) channels (not potentially epileptogenic outside the resection); (iv) as black in the red-shaded area if they contain false negative (FN) channels (not potentially epileptogenic inside the resection). Boundaries of prior resections are schematically shaded in yellow (only Patients 3 and 9 had a previous resection).

