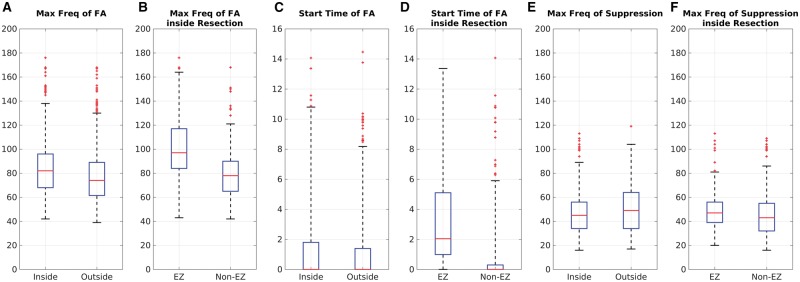
Figure 5.
Boxplots of maximum frequency and timing comparison. (A) Maximum frequency of fast activity inside and outside resection; (B) maximum frequency of fast activity inside resection classified as epileptogenic zone and non-epileptogenic zone contacts. (C) The start time of fast activity inside and outside resection. (D) The start time of fast activity inside resection classified as epileptogenic zone and non- epileptogenic zone contacts. (E) The maximum frequency of suppression inside and outside resection. (D) The maximum frequency of suppression inside resection classified as epileptogenic zone and non- epileptogenic zone contacts. The boxplot spans the two central quartiles of the data around the median (red line), and the whiskers extend to a maximum of 1.5 times the box span, or to the last data point, whichever is shorter. The remaining data points are outliers. EZ = epileptogenic zone.

