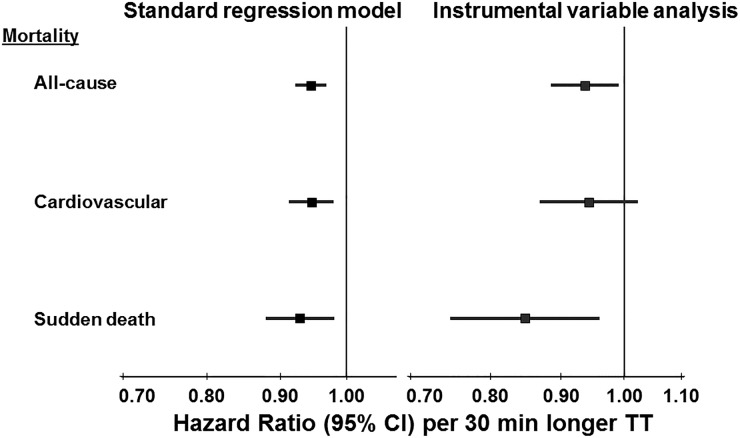
FIGURE 4.
HR of mortality associated with prescribed treatment time (TT, per 30 min longer) in DOPPS phases 1–3 (1996–2008). Cox regression models stratified by country and phase, accounted for facility clustering, and adjusted for age, sex, black race, time on dialysis, body mass index, 13 summary comorbid conditions, residual kidney function, prescribed blood flow rate, and catheter use. Adapted with permission from Tentori et al. [12].

