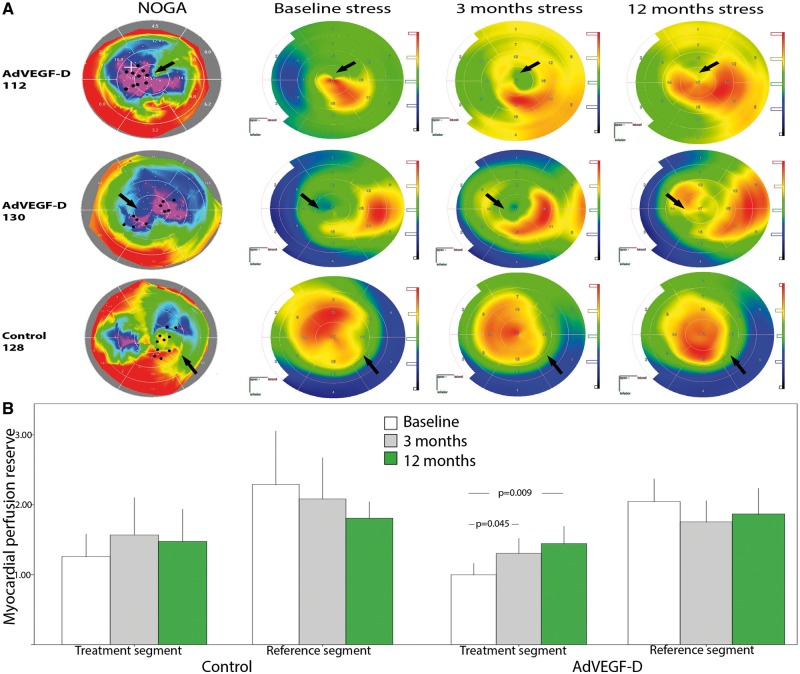
Figure 3.
(A) Representative images of combined NOGA and stress PET radiowater images of two AdVEGF-D treated patients and one control patient. Black dots and arrows indicate sites for gene injections in viable but poorly perfused myocardium. Myocardial blood flow improved in the AdVEGF-D patients visualized as increases in red colour during the follow-up. Perfusion did not increase in the control patient. (B) Myocardial perfusion reserve in the treated and reference segments of the control and AdVEGF-DΔNΔC-treated patients. Colour scales in NOGA and PET maps as in Figure 1. Values are mean ± standard deviation.

