. 2018 Mar 5;7:e31989. doi: 10.7554/eLife.31989

Figure 3. Upstream transcriptional termination promotes ATP16 expression.

(A) Northern blot analysis of ATP16 and SCR1 (as loading control) transcripts in wild type, cut60Δ::URA3, cut60Δ::SUT129 + sut129Δ::URA3, cut60Δ::5’C-3’S + sut129Δ::URA3, cut60Δ::5’S-3’C + sut129Δ::URA3 strains (n = 4). (B) Serial dilution growth of W303 (wild type for nrd1-1), nrd1-1, nrd1Δ151–214 and BY4741 (wild type for nrd1Δ151–214) strains on SC-Glucose and SC-Glycerol plates (n = 2). (C) Northern blot analysis of ATP16 and SCR1 (as loading control) transcripts in W303 (wild type for nrd1-1), nrd1-1, nrd1Δ151–214 and BY4741 (wild type for nrd1Δ151–214) (n = 3). (D) Northern blot analysis of ATP16 and SCR1 (as loading control) transcripts in wild type, cut60Δ::URA3, cut60Δ::CUT48, cut60Δ::CUT217, cut60Δ::CUT95, cut60Δ::CUT277, cut60Δ::CUT170 and cut60Δ::#78 strains (n = 3). (E) Northern blot analysis of ATP16 and SCR1 (as loading control) transcripts in wild type, cut60Δ::URA3 and cut60Δ::CUT60 strains (n = 3). (F) Northern blot analysis of ATP16 and SCR1 (as loading control) transcripts in wild type, cut60Δ::URA3+, cut60Δ::URA3++ and cut60Δ::URA3+trp1 terminator strains (n = 3).

Figure 3—source data 1. Table of 68 CUTs with similar genomic configuration to CUT60.
CUT name and genomic coordinates are indicated. Distance and identifier of tandem downstream gene is given. NET-seq data inform on the directionality of the downstream gene promoters. The read-through index calculated from Pol II PAR-CLIP data following Nrd1 depletion is shown. Nrd1 and Nab3 PAR-CLIP data are given normalized to 4sU-seq data to quantify Nrd1 and Nab3 binding.
DOI: 10.7554/eLife.31989.011

Figure 3.

Figure 3—figure supplement 1. Genomic replacement of CUT60.

Figure 3—figure supplement 1.

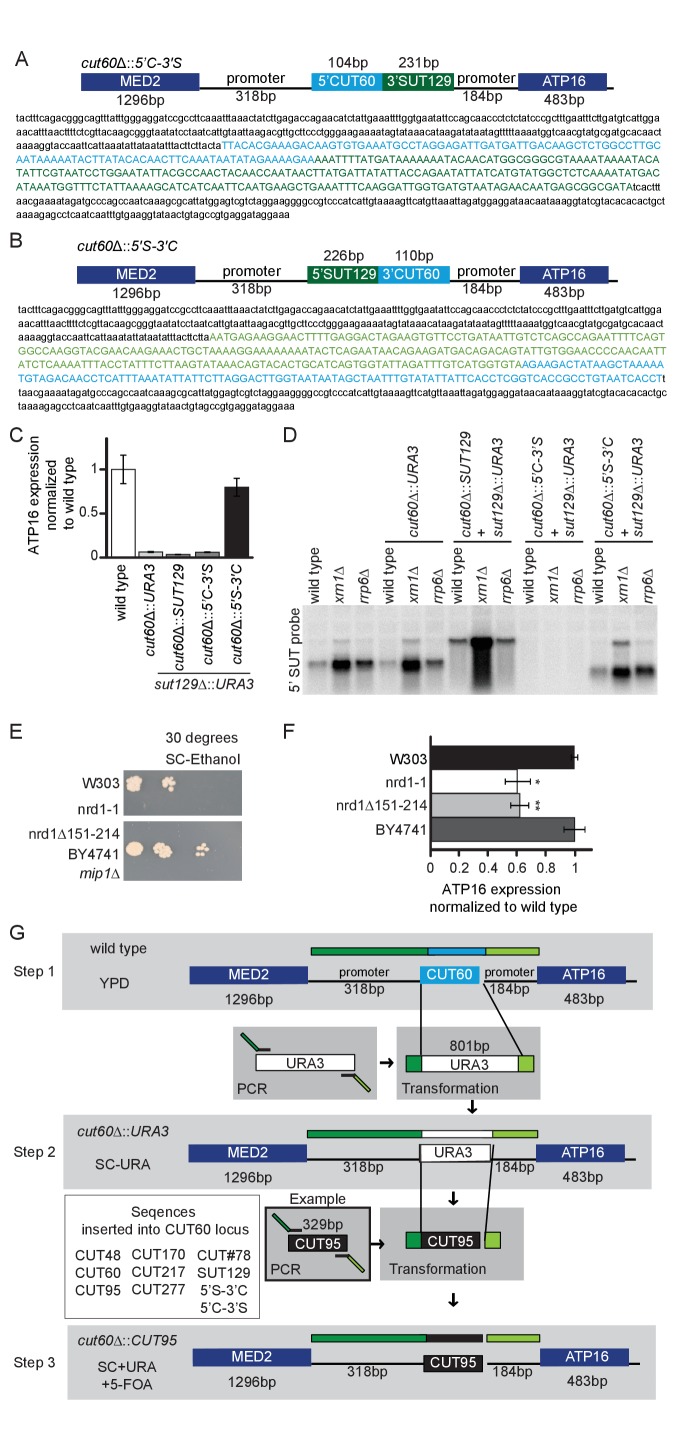
(A) Schematic representation of the locus between MED2 and ATP16 when the 5’ sequence of SUT129 is fused to the 3’ sequence of CUT60, and this fusion sequence is inserted into the location of CUT60. The DNA sequences of the individual parts are shown in the lower panel. (B) Schematic representation of the locus between MED2 and ATP16 when the 5’ sequence of CUT60 is fused to the 3’ sequence of SUT129, and this fusion sequence is inserted into the location of CUT60. The DNA sequences of the individual parts of this locus are shown in the lower panel. (C) Quantification of ATP16 expression in northern blot shown in Figure 3A normalized to wild type. Data of expression in wild type, cut60Δ::URA3, cut60Δ::SUT129 + sut129Δ::URA3, cut60Δ::5’C-3’S + sut129Δ::URA3 and cut60Δ::5’S-3’C + sut129Δ::URA3 strains. Error bars are s.e.m. of 4 biological replicates (D) Northern blot analysis with a probe against the 5’-region of SUT129 transcripts in wild type, cut60Δ::URA3, cut60Δ::SUT129 + sut129Δ::URA3, cut60Δ::5’C-3’S + sut129Δ::URA3 and cut60Δ::5’S-3’C + sut129Δ::URA3 strains. For all strains the transcripts were analyzed in three different backgrounds: wild type, rrp6Δ and xrn1Δ indicated on top (n = 1). (E) Serial dilution growth of W303 (wild type for nrd1-1), nrd1-1, nrd1Δ151–214 and BY4741 (wild type for nrd1Δ151–214) strains on SC-Ethanol plates (n = 2). (F) Quantification of ATP16 expression in northern blot shown in Figure 3C. ATP16 expression in W303 (wild type for nrd1-1) and nrd1-1 are normalized to W303. ATP16 expression in BY4741 and nrd1Δ151–214 are normalized to BY4741 (wild type for nrd1Δ151–214). Error bars are s.e.m. of 3 biological replicates. (G) Schematic representation of the three steps needed to generate precise site-specific genomic replacements of CUT60. In step1 wild type yeast needs to be transformed with a PCR product containing the coding sequence of URA3 with overhangs homologous to the sequences upstream and downstream of CUT60. These transformants need to be selected on plates lacking uracil (SC-URA). In step two these transformants need to be transformed with a PCR product containing the sequence of the non-coding sequence for desired CUT60 replacements (CUT95 is shown as example) with overhangs homologous to the sequences upstream and downstream of CUT60. In Step 3, transformants are selected on plates containing 5-FOA and additional uracil (SC + URA + 5 FOA) and confirmed by genotyping.
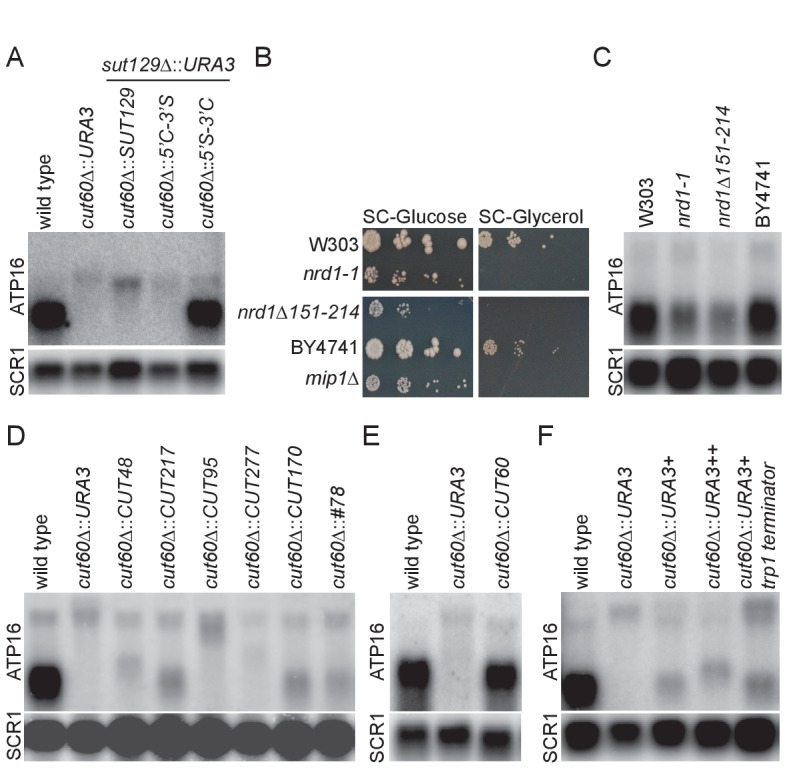
Figure 3—figure supplement 2. Genomic configuration of CUTs selected for CUT60 replacement.

Figure 3—figure supplement 2.

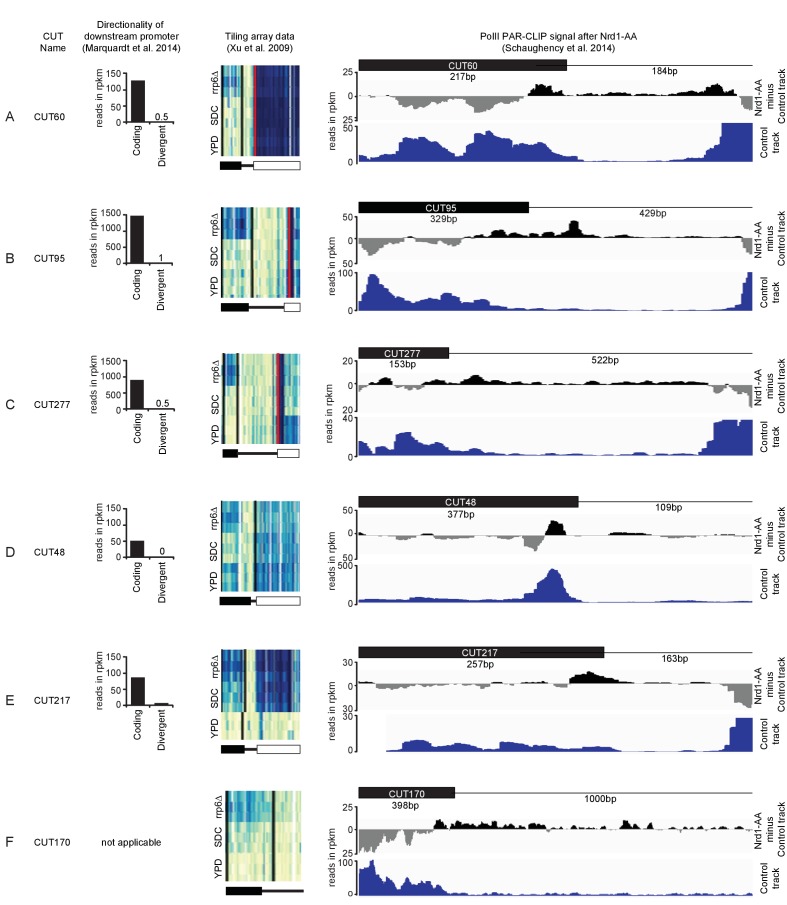
(A–F) Visualization of three features of CUT60 and CUTs selected for genomic replacement of CUT60. From left to right the name of the CUT, a plot showing the directionality of the promoter of the downstream protein coding gene, a genome browser snapshot of the rrp6Δ, SDC and YPD track described in (Xu et al., 2009) and a genome browser snapshot visualizing differential Pol II PAR-CLIP signal after Nrd1 Anchor-away. The directionality of the downstream protein coding gene is calculated using NET-seq data from (Marquardt et al., 2014) and shown for the coding and the divergent direction of the promoter. Screenshots of the browser described in (Xu et al., 2009) show the level of transcription intensity across the CUTs and the respective downstream sequence by tiling array analysis. The transcription intensity is shown for three replicates in rrp6Δ background, for wild type yeasts grown in SDC medium and wild type yeast grown in YPD medium. Dark blue lines indicate high transcription, white lines indicated low transcription. The schematic underneath the three tracks indicate the starts of the CUTs (black box), the start and end of the downstream promoter (black line) and the start of the downstream gene (white box). The last screenshots visualizing the change of Pol II PAR-CLIP signal upon Nrd1 depletion consist of two tracks: (i) Upper: the difference track where the Pol II PAR-CLIP signal in the negative control (baseline) sample was subtracted from the Nrd1-anchor away (AA) sample. Genomic regions covered by the positive (black) difference values are interpreted as intervals where the transcription read-through is suppressed by Nrd1-dependent termination in the wild type, but becomes visible in Nrd1-AA samples; (ii) Lower: the original baseline (negative control) track to show the overall magnitude of nascent transcription at given region.
Figure 3—figure supplement 3. Features preventing Transcriptional Interference highlighted in CUT60 and CUTs selected for genomic replacements.

Figure 3—figure supplement 3.

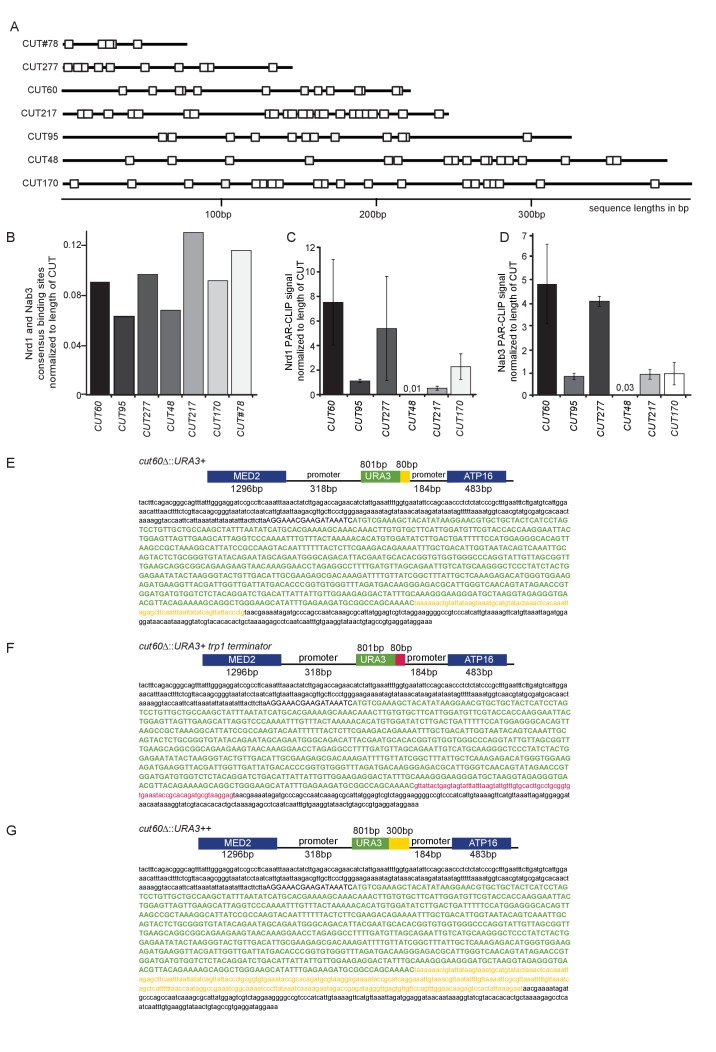
(A) Schematic representation of all CUTs inserted at the CUT60 locus, their length and their Nrd1p/Nab3p binding sites. Binding sites from (Jamonnak et al., 2011; Carroll et al., 2004; Wlotzka et al., 2011; van Nues et al., 2017; Delan-Forino et al., 2017; Schulz et al., 2013) are shown and indicated as white boxes. (B) Number of consensus Nrd1 and Nab3 binding sites normalized to the length of the individual CUTs are shown for CUT60, CUT95, CUT277, CUT48, CUT217, CUT170 and CUT#78. (C) Nrd1 PAR-CLIP signal (Schulz et al., 2013) normalized to length of the CUTs is shown for CUT60, CUT95, CUT277, CUT48, CUT217 and CUT170 (n = 2). (D) Nab3 PAR-CLIP signal (Schulz et al., 2013) normalized to length of the CUTs is shown for CUT60, CUT95, CUT277, CUT48, CUT217 and CUT170 (n = 2). (E) Schematic representation of the locus between MED2 and ATP16 when the URA3 including an 80 bp endogenous URA3 terminator as present in pRS316 (indicated in yellow) is inserted into the location of CUT60. The DNA sequences of the individual parts of this locus are shown in the lower panel. (F) Schematic representation of the locus between MED2 and ATP16 when the URA3 including an 80 bp terminator derived from the TRP1 locus (indicated in red) is inserted into the location of CUT60. The terminator in this sequence is homologous to the TRP1 terminator found in pRS314. The DNA sequences of the individual parts of this locus are shown in the lower panel. (G) Schematic representation of the locus between MED2 and ATP16 when the URA3 including a 300 bp (indicated in yellow) terminator as present in pRS316 is inserted into the location of CUT60. The DNA sequences of the individual parts of this locus are shown in the lower panel.