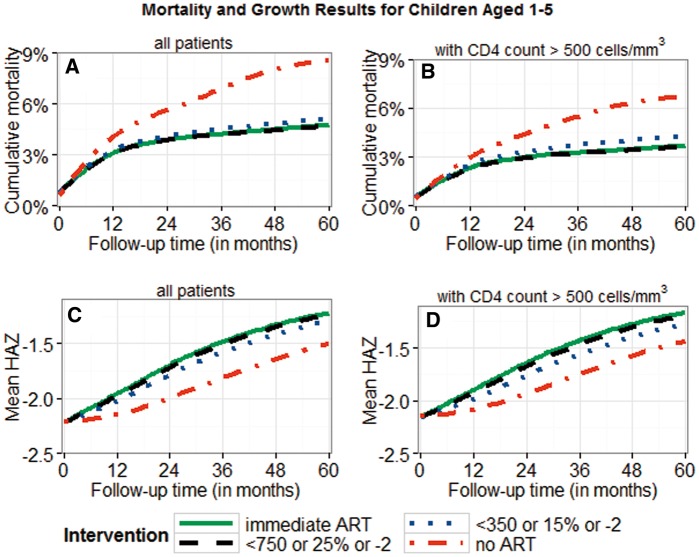
Figure 2.
Cumulative mortality and mean HAZ for children aged ≥ 1 and < 5 years. Results are displayed for different intervention strategies and patient groups; 95% bootstrap confidence intervals for absolute estimates and estimated differences between strategies are listed in Table 3a. All results were obtained using the g-formula. Treatment thresholds refer to CD4 count (< 350/750), CD4% (< 15%/25%), and WAZ < -2). Panels B and D are restricted to patients presenting with CD4 count > 500 cells/mm3.

