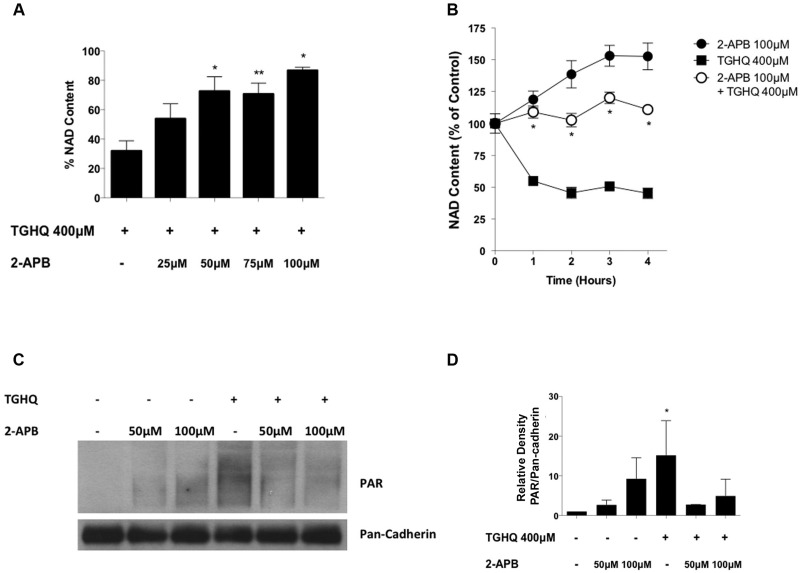
Figure 3.
SOC entry is coupled to PARP-1 activation. (A) HK-2 cells were pretreated 30 min with 2-APB at various concentrations (25–100 μM) then co-treated with TGHQ 400 μM. Total NAD+ was measured using the enzymatic cycling assay 2 h after initial TGHQ treatment. Data are mean ± SE; n ≥ 3. (B) HK-2 cells were pre-treated 30 min with 2-APB 100 μM then co-treated with TGHQ 400 μM at various time points. Total NAD+ was measured using the enzymatic cycling assay. Data are mean ± SE; n ≥ 3. Data are mean ± SE; n ≥ 3. *P < .05, **P < .01 when compared with TGHQ by one-way ANOVA followed by a post-hoc Tukey’s test. (C) HK-2 cells were treated with 400 μM TGHQ for 30 min in the presence and absence of 2-APB (50 and 100 μM). Cells were collected using a PAR lysis buffer and analyzed by Western blot using an anti-PAR antibody. (D) Densitometric and statistical analysis from three independent biological experiments. Data are mean ± SE; n = 3. *P < .05 when compared with control by one-way ANOVA followed by a post-hoc Tukey’s test.

