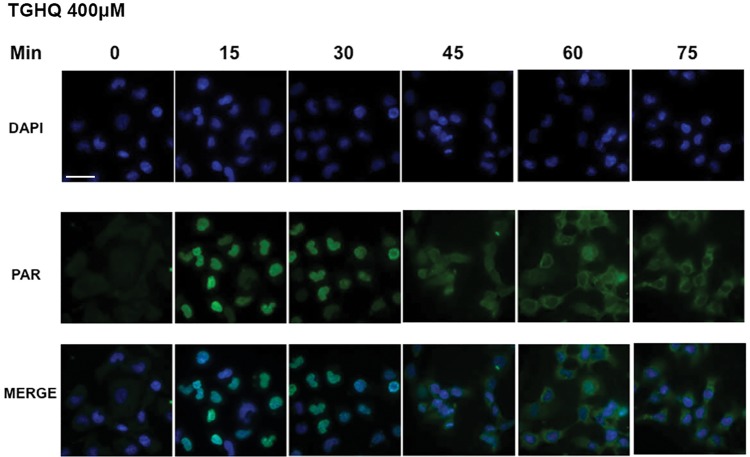
Figure 7.
Identification of cytosolic PAR following TGHQ treatment. HK-2 cells were treated with 400 μM TGHQ for various time periods (0–75 min). Cells were fixed in a 1:1 MeOH:acetone solution and probed with anti-PAR antibody, then incubated with Alexa Fluor 488 secondary antibody and DAPI stain. Cells were imaged using ×40 magnification on a deconvolution microscope and images were collected using DeltaVision softWoRx. Images were analyzed using the NIH provided software ImageJ. Scale bar 100 µm.

