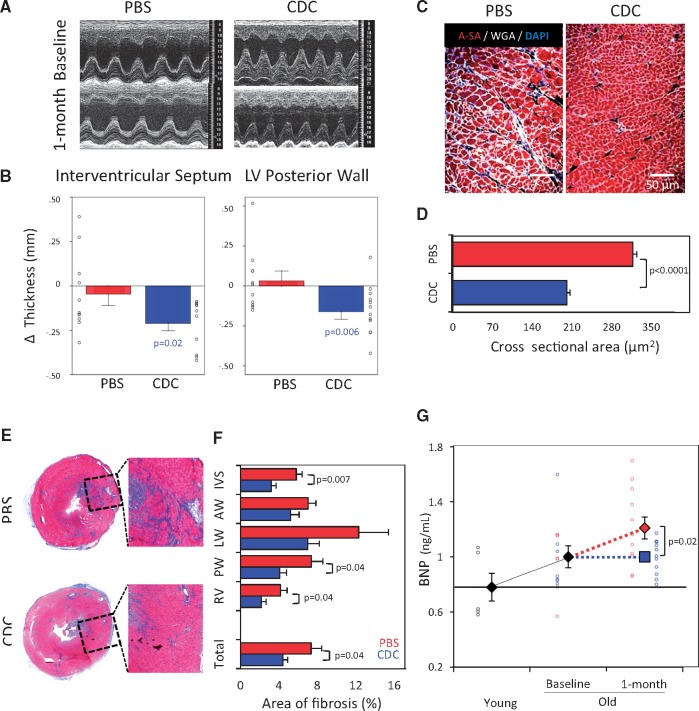
Figure 2.
Structural changes of the left ventricle and circulating levels of BNP. (A) Representative M-mode echocardiographic images from a rat from the phosphate-buffered saline group (PBS-control), and from a rat in the cardiosphere-derived cell (CDC) transplanted group. (B) CDC-injected rats (n = 11) had decreased echo-measured thickness of the interventricular septum and LV posterior wall. The control PBS rats (n = 11) showed an opposite trend. (C) Histological sections of myocardium from a rat in each group. (D) Pooled data for cardiomyocyte cross sectional area in CDC-injected (n = 6) vs. PBS-injected (n = 5) rats. (E) Representative heart sections stained with Masson’s trichrome. (F) CDC-group (n = 6) exhibited a decrease of fibrosis vs. control PBS (n = 5). (G) Serum levels of BNP in young (n = 5), old animals at baseline (n = 14) and after 1-month of treatment with CDC (n = 11) or PBS (n = 11). IVS: interventricular septum; LV-AW: left ventricular anterior wall; LV-LW: left ventricular lateral wall; LV-PW: left ventricular posterior wall; RV: right ventricular free wall. P-values: all significant values are represented. Blue values (CDC group) represent the significance of the difference between baseline and end point within the group. Black values represent the significance between the groups.

