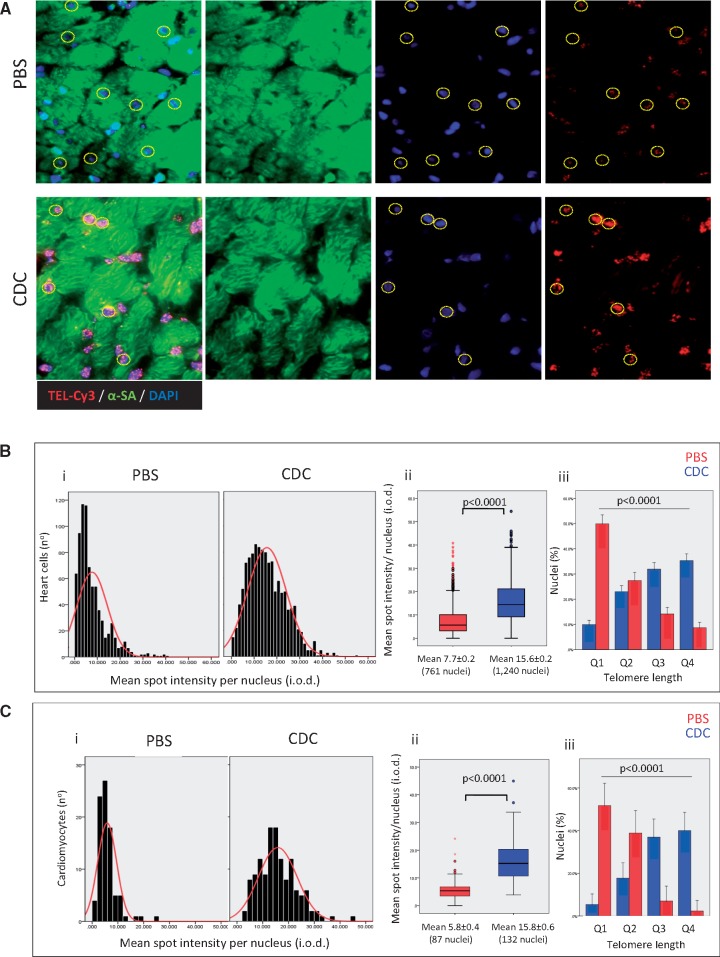
Figure 4.
Telomere length of heart cells. (A) Representative detail of a confocal maximum projection images of telomere Q-FISH (TEL-Cy3) and alpha-sarcomeric actinin (α-SA) immunofluorescence in old animals treated with phosphate-buffered saline (PBS, n = 5) and old rats transplanted with cardiosphere-derived cells (CDC, n = 6). Cardiomyocyte nuclei were manually selected using the α-SA immunofluorescence image. Only unambiguously identified cardiomyocytes were considered for analysis. Dashed lines indicate cardiomyocytes with the telomere signal. (B) Telomere length distribution (i), mean telomere length (ii), and cell distribution according to quartiles (Q1—the shortest and Q4—the longest) of telomere length (iii) in entire population of heart cells. (C) Telomere length distribution (i), mean telomere length (ii), and cell distribution according to quartiles (Q1—the shortest and Q4—the longest) of telomere length (iii) in cardiomyocytes.

