
Figure 1.
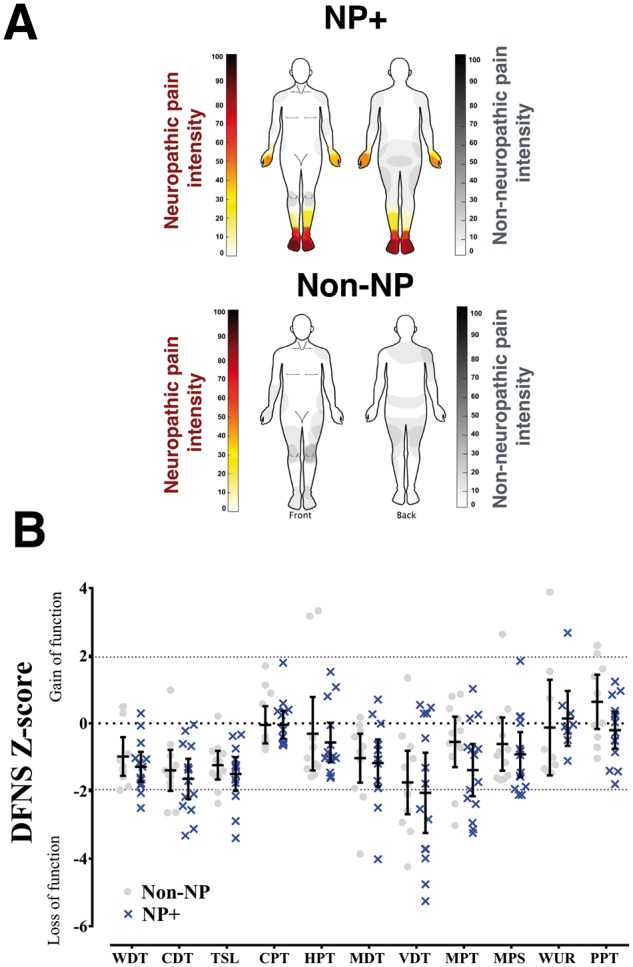
Neuropathic pain severity. (A) Heat maps summarize the mean pain intensity and pain location on the body as generated from each participant’s 7-day pain diary. Diabetes-associated neuropathic pain is shown in red and non-neuropathic pain is in grey for both groups. (B) Scatter plot and mean ± 95% CI of z-scores for QST parameters for each group (NP+: blue; non-NP: grey). The z-score indicates the number of standard deviations the participant data are from the mean of the control population (i.e. the normative data). A z-score that lies between −2 and +2 is considered within the normal reference range. Positive z-scores denote gain of function, whereas negative z-scores denote loss of function. CDT = cold detection threshold; CPT = cold pain threshold; HPT = heat pain threshold; MDT = mechanical detection threshold; MPS = mechanical pain sensitivity; MPT = mechanical pain threshold; PPT = pressure pain threshold; TSL = thermal sensory limen; VDT = vibration detection threshold; WDT = warm detection threshold; WUR = wind-up ratio.