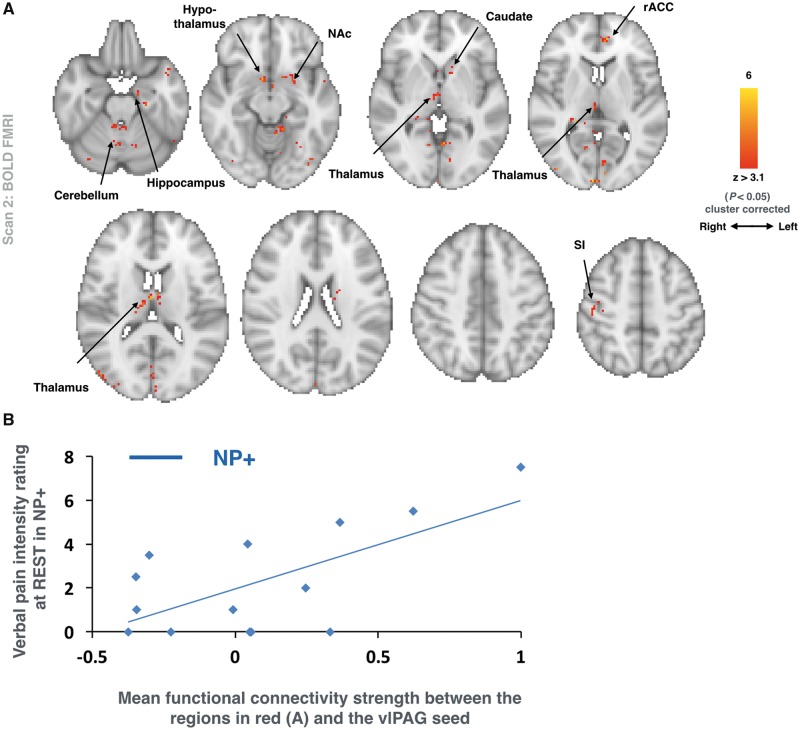
Figure 3.
Enhanced vlPAG functional connectivity in NP+. (A) Group comparison (NP+ > Non-NP) of whole brain functional connectivity strength with the vlPAG seed (from Scan 2) as a function of the background (i.e. ‘resting’) pain intensity ratings (from Scan 2). Voxels within which this relationship was greater in the NP+ group are in red (n = 26; mixed effects: z > 3.1, P < 0.05 cluster corrected). The axial slices show the extent of activation across the whole brain. Radiological convention is used. (B) For clarity, a plot of the correlation between the magnitude of vlPAG functional connectivity and the intensity of the pain at rest reported by NP+ participants is displayed.

