Figure 1.
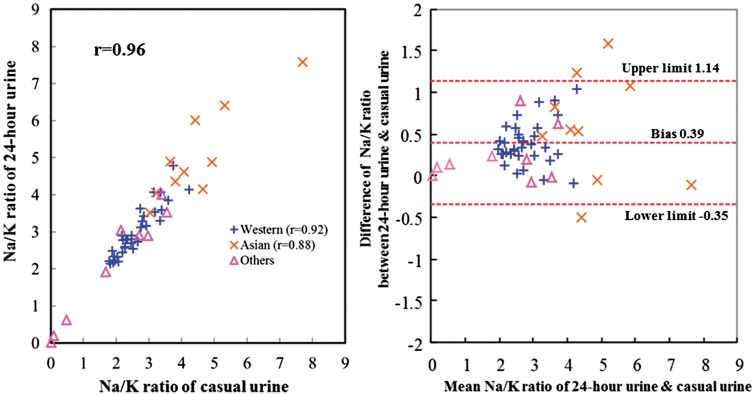
Plot of Na/ K ratio of casual urine vs 24-h urine and Bland–Altman plot (52 population samples).
Pearson correlation coefficient between 24-h urinary Na/K ratio and casual urinary Na/K ratio was r = 0.96 across the 52 population samples. Bias between 24-h urinary Na/K ratio and casual urinary Na/K ratio by the Bland–Altman method was 0.39. Others are nine population samples from Argentina, Colombia, Mexico, Trinidad and Tobago, Zimbabwe, Yanomamo and Xingu Indians in Brazil, Kenya and Papua New Guinea; these nine samples were neither Western populations (n =33) nor Asian populations (n =10).

