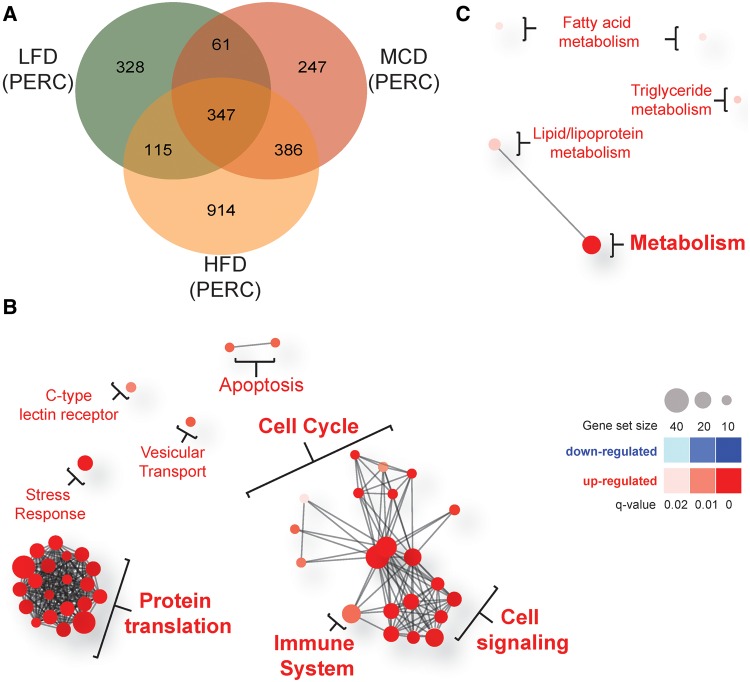
Figure 4.
Diet-specific effects of PERC exposure on liver gene expression. Mice were fed a LFD, HFD, or MCD for 8 weeks prior to oral exposure to PERC (300 mg/kg/day; 5 days). All comparisons are made between vehicle-treated diet-matched control mice. A, Venn diagram showing numbers of differentially expressed genes in PERC-exposed mice. B–C, Network plots of gene sets enriched specifically in the 914 and 247 genes differentially expressed specifically in HFD-fed (B) and MCD-fed mice (C), respectively. Red circles represent pathways that were significantly induced, while blue circles represent repressed pathways (FDR-adjusted q-value <0.05). The size of the circle is proportional to the number of genes that are enriched in that pathway. The thickness of connecting lines between circles is proportional to the number of common genes between those 2 pathways. At least 10 genes needed to be common between pathways in order for a line to be drawn. Color and size keys are provided on the right.

