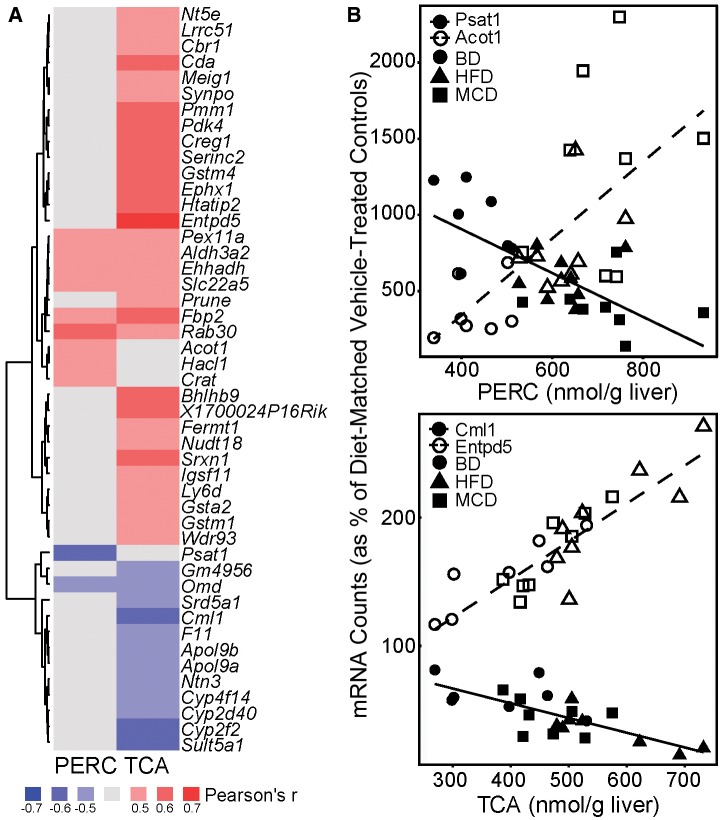
Figure 6.
Correlation of hepatic concentrations of PERC and TCA with liver gene expression changes. A,. Heatmap showing the Pearson’s r correlation coefficient for genes significantly correlated with hepatic concentrations of PERC (left) or TCA (right). All genes shown had a Benjamini-Hochberg adjusted FDR q-value < 0.05. Pearson’s r values are shown within each cell. Red cells = positively correlated (r ≥ 0.6); Blue cells = negatively correlated (r ≤ 0.6; Gray cells = not correlated (−0.6 < r < 0.6). B, Select genes from (A) are presented along as linear regression of gene expression to hepatic PERC (top) or TCA (bottom) concentrations. Each dot represents an individual animal and the red or blue lines represent the linear regression lines. To eliminate the effect of diet alone, individual gene raw count data were normalized to the percentage of the average diet-matched vehicle-treated control prior to running correlation analyses.

