Figure 3.
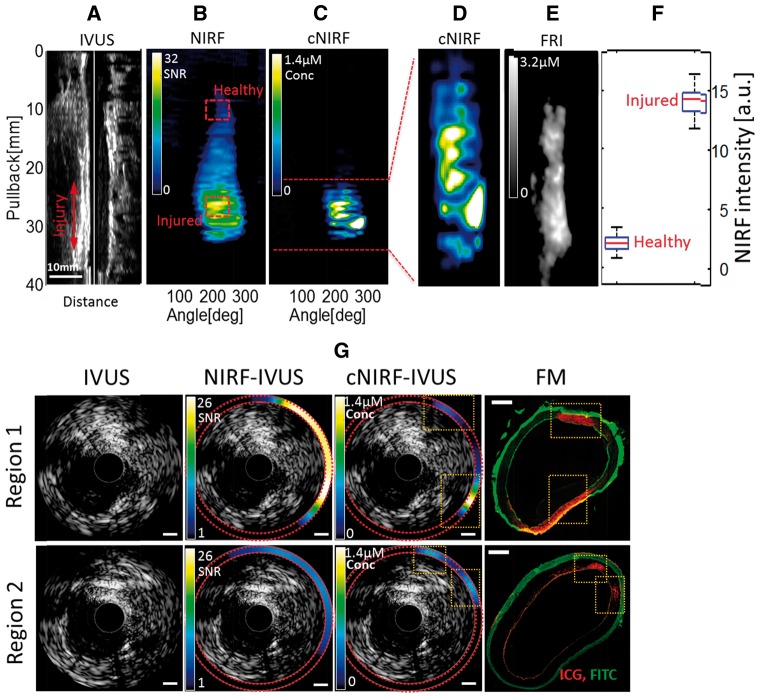
In vivo cNIRF-IVUS imaging of vascular injury with ICG in a swine iliac artery using the 9F/15MHz hybrid cNIRF-IVUS catheter. (A) Ultrasound longitudinal image of the injured artery; (B, C) the corresponding raw NIRF image of ICG-demarcated vascular injury induced by the angioplasty balloon before and after correction. Note, that unlike IVUS, NIRF shows clear demarcation of injured region labelled by ICG. (D) Expanded view of the distance-corrected NIRF signal from the injured area of the artery. (E) FRI of the resected injured iliac artery corresponded well with the in vivo distance-corrected cNIRF image shown in panel (D). (F) NIRF signal specificity was assessed by comparing NIRF intensities from healthy and injured areas of the vessel marked with red dashed squares in panel (B). On each box, the central red mark is the median value, the edges of the box are the 25th and 75th %, and the whiskers extend to the most extreme data points. (G) Comparison of the standalone IVUS, and the integrated cNIRF-IVUS cross sectional images before and after blood attenuation correction with FM micrographs of anatomically matched tissue sections. Note that injury is not apparent by structural imaging with standalone IVUS. In comparison, injury demarcated by ICG deposition is clearly recognized on the cNIRF-IVUS merged images in Region 1 and Region 2, as confirmed by FM (orange dotted boxes; red pseudocolor = ICG, green pseudocolor = FITC autofluorescence). Scale bars in NIRF and cNIRF images, 1 mm. Scale bar in FM images, 0.5 mm.

