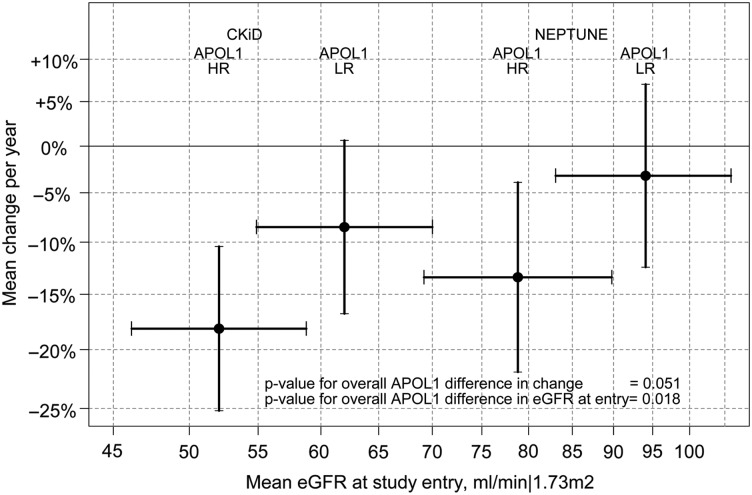
FIGURE 2.
Graphical depiction of eGFR level at study entry (x-axis) and percent change per year (y-axis) by study and APOL1 risk status from linear mixed effects model (random intercepts and slopes). The black circles represent the point estimates with bars corresponding to the associated 95% confidence intervals. CKiD, Chronic Kidney Disease in Children; NEPTUNE, Nephrotic Syndrome Study Network; LR, low risk; HR, high risk; APOL1, apolipoprotein L1; eGFR, estimated glomerular filtration rate.

