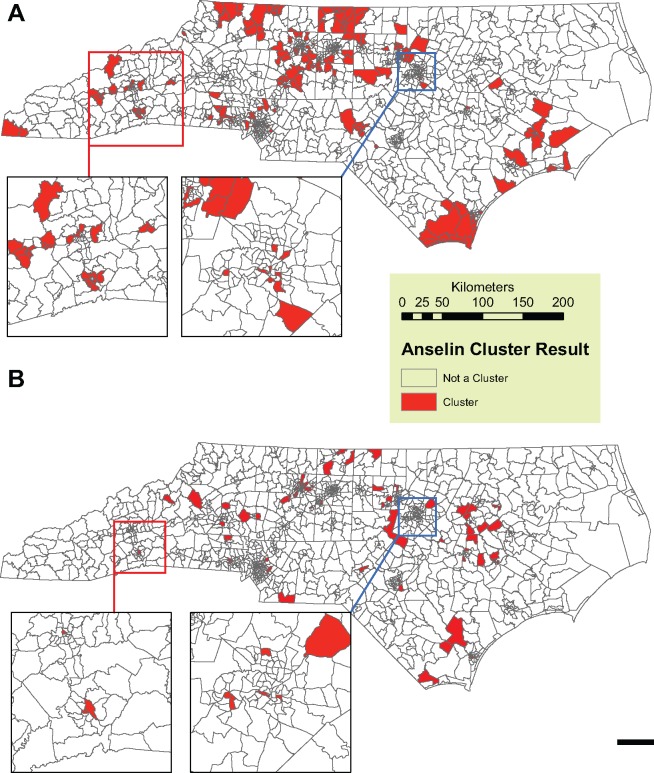
Figure 1.
Anselin Local Moran’s I clusters (Filled) for excess, normalized (A) lung cancer and (B) stomach cancer incidence calculated in ArcGIS 10.0.Cases are assigned a 1 status if they within a census tract identified a cluster. All other cases are assigned a 0 status. Each map has two inset maps of the Asheville (West Inset) and Raleigh (East Inset) metropolitan areas. Geomasked cancer cases are not shown, in order to protect spatial identity as per the data use agreement.

