Figure 1.
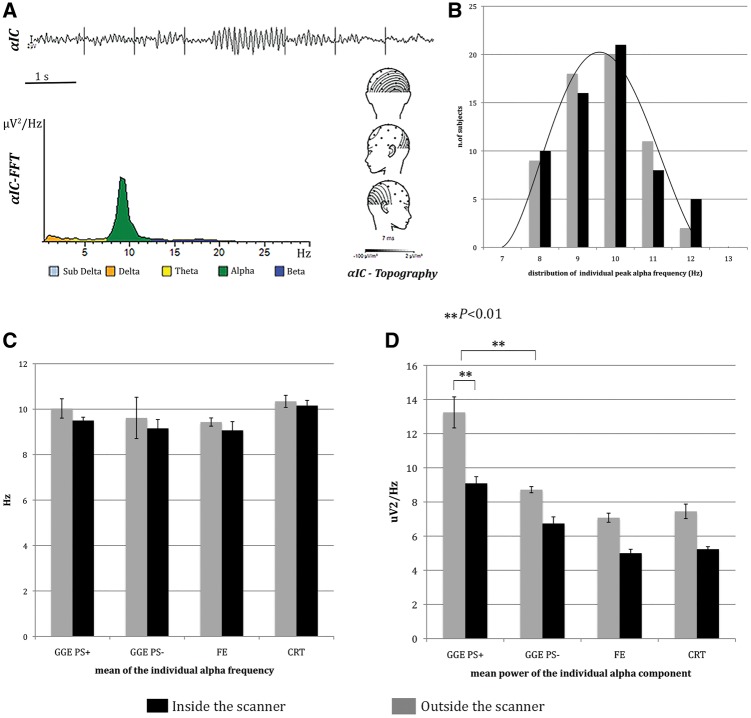
Alpha power estimation and analysis. (A) Individual alpha band identification and calculation in a representative example. After visual identification of the αIC (top), the posterior alpha component is selected based on the power spectrum (bottom left) and average topography (bottom right). (B–D) Histograms of alpha parameters recorded outside (grey) and inside the scanner (black). (B) Histograms show the Gaussian distribution of individual peak alpha frequency within alpha band. (C) Histograms illustrate the mean individual alpha frequency in the different subgroups of patients and in controls. (D) Histograms display the mean alpha power in the different subgroups of patients and in controls. The GGE PS+ shown significantly higher alpha power compared to others both during scanning and outside. The mean alpha power was significantly lower inside then outside the scanner in all the studied population. The bars represent the standard error. **P < 0.01. CRT = control; FE = focal epilepsy.

