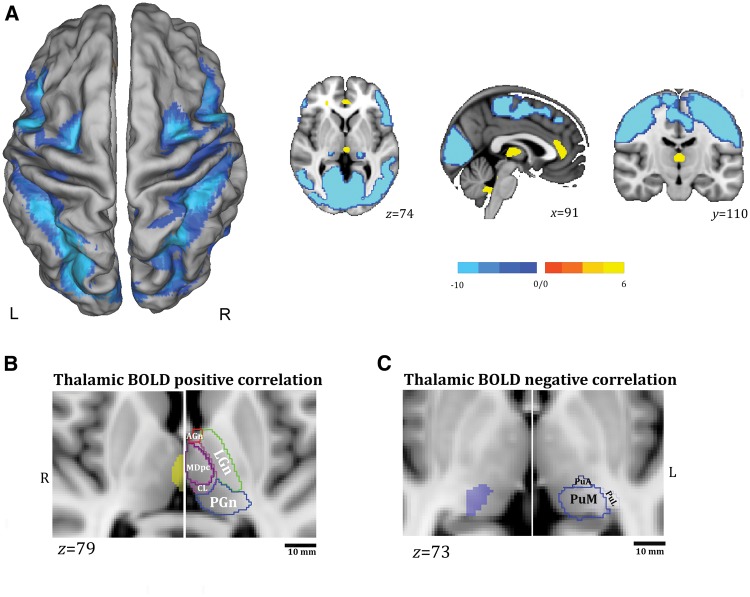
Figure 2.
Whole-population BOLD findings. (A) Alpha-BOLD correlation map related to all the subjects considered together (P < 0.05 corrected for FWE). The functional maps have been warped to the PALS-B12 atlas in caret (dorsal view) for right (R) and left (L) hemisphere (left) and overlaid onto representative canonical slices, axial, coronal and sagittal view (right) for visualization purposes. The yellow colour identifies the positive correlations to alpha power, the light-blue colour the negative correlations. See text for details. (B and C) Relationship between BOLD thalamic changes and thalamic nuclei as provided by digital version of the Morel’s atlas of human thalamus (Morel et al., 1997; Krauth et al., 2010). Thalamic positive (B) (P < 0.05 corrected for FDR) and negative (C) (P < 0.05 corrected for FWE) BOLD correlations are overlaid onto the MNI template (1 mm) (axial slices) as provided by FSL (FMRIB Software Library) after linear transformation using FMRIB Linear Image Registration Tool (FLIRT). For each panel, the localization of the BOLD change is compared with the thalamic atlas. The thalamic atlas is displayed onto the canonical T1-1 mm image as implemented in FSL (FMRIB Software Library). Canonical T1 slices are enlarged for visualization purposes. The thalamic nuclei have been indicated by different colours for visualization purposes and grouped according to Morel (1997). LGn, green colour: lateral group of thalamic nuclei that includes the ventroposterior complex, ventral lateral posterior/anterior, and ventral anterior and ventral medial nuclei. AGn, red colour: anterior group of thalamic nuclei that includes anteroventral, anteromedial, anterodorsal, and lateral dorsal nuclei. PGn, blue colour: the posterior group of thalamic nuclei that includes medial and lateral geniculate nuclei, posterior, suprageniculate/limitans, lateral pulvinar nucleus (PuL), medial pulvinar nucleus (PuM) and anterior pulvinar nucleus (PuA). Pink colour shows the mesial group of thalamic nuclei: MDmc = mediodorsal nucleus, magnocellular division; MDpc = mediodorsal nucleus, parvocellular division; CL = Central lateral nucleus. Scale bar = 10 mm. R = right; L = left.

