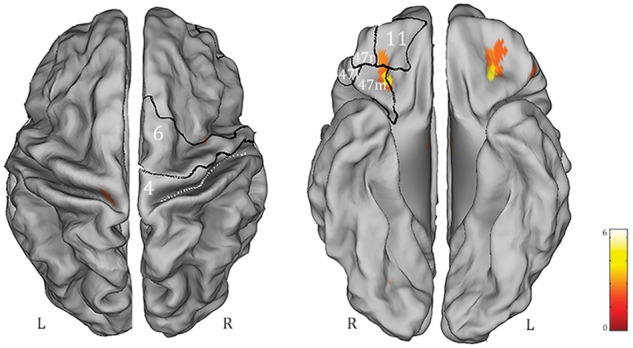
Figure 5.

BOLD changes (derived from statistical comparison P < 0.05 corrected for FDR) between functional connectivity with seed region at the thalamic medial dorsal nuclei in GGE PS+ versus controls. The resulted map has been warped to the PALS-B12 atlas in caret (dorsal and ventral view) for right (R) and left (L) hemisphere. For localization purposes, functional results on the right hemisphere were plotted and compared against six Brodmann areas indicated by the white numbers. The displayed Brodmann areas cover part of the precentral regions and the orbitofrontal cortex subdivisions (Henssen et al., 2016). Only increases of functional connectivity in GGE PS+ population were detected.
