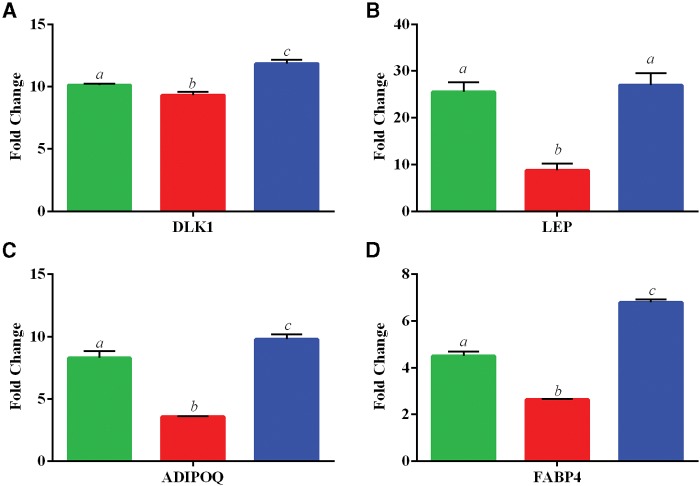
FIG. 4.
Expression of adipogenic-related genes. Data is shown as the mean fold change ± SD (undifferentiated/differentiated) ASC for 3 in vivo exposed groups of 0 ppb (green/left), 300 ppb (red/middle), and 1000 ppb (blue/right). Genes investigated include A, Pre Adipocyte Factor 1 (DLK1), B, Leptin (LEP), C, Adiponectin (ADIPOQ), and D, Fatty Acid Binding Protein 4 (FABP4). Statistically significant groups (N = 3 per exposure group) as determined by One-Way ANOVA (P-value < 0.05) are depicted by the letters atop the bars for each gene set (ie a ≠ b ≠ c).

