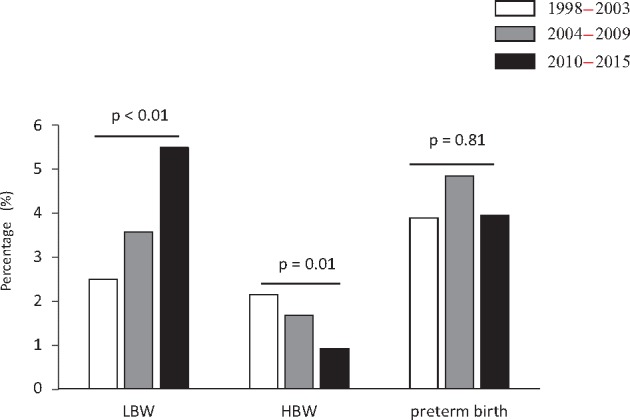
FIGURE 1.

LBW, HBW and preterm birth prevalence rates during the 1998–2003, 2004–09 and 2010–15 survey periods. Categorical variables are presented as percentages. LBW, low birthweight (<2500 g); HBW, high birthweight (>4000 g); preterm birth, gestational age <37 weeks.
