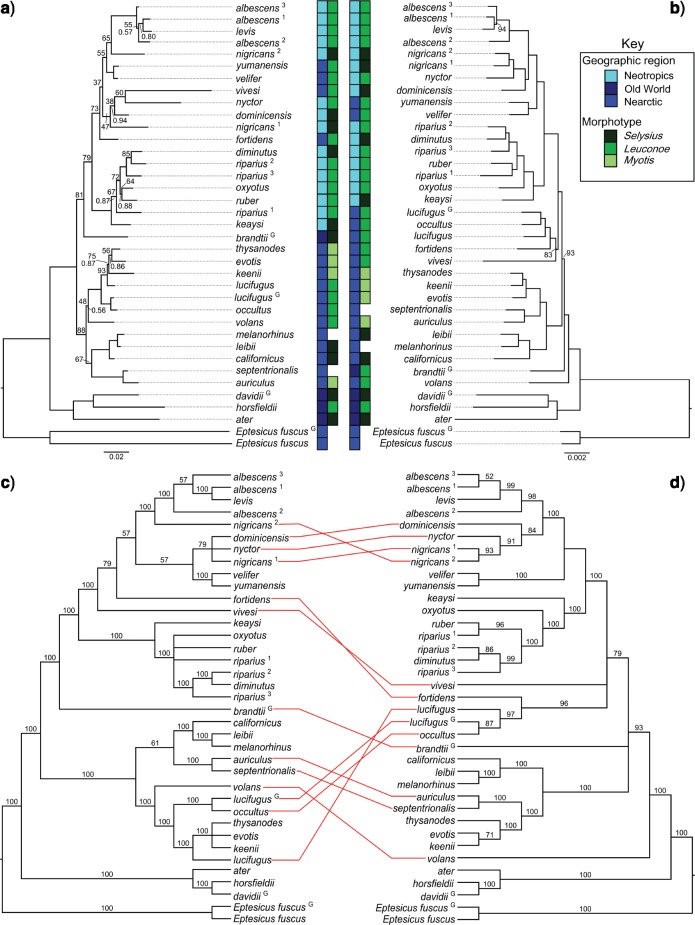
Fig. 1.
Comparison of nuclear and mitochondrial phylogenetic trees of Myotis. The most common mitochondrial (a) and nuclear (b) topologies. The mitochondrial topology arises from Bayesian and maximum likelihood analysis of the amino acid sequences portioned based on the PartitonFinder recommendations. The nuclear topology is from the 55% complete data matrix partitioned based on the recommendations of PartitionFinder. For clarity, bootstrap values greater than 95 and clade probability values greater than 0.95 have been omitted from the nuclear consensus tree. Majority-rule consensus trees from 28 mitochondrial (c) and 294 nuclear (d) topologies. Values above the branches in the consensus trees (c,d) are bipartition frequencies for that clade across all nuclear or mitochondrial topologies. Conflicting tips between data types (consensus nuclear vs. consensus mitochondrial) are indicated with red lines between the topologies. Biogeographic regions are color coded, as are subgeneric classifications based on morphotypes, as defined by Findley (1972). Species with more than one sample are designated with a superscript that is referenced in Table 1. Specimens derived from whole genome alignments are designated with a superscript “G.”

