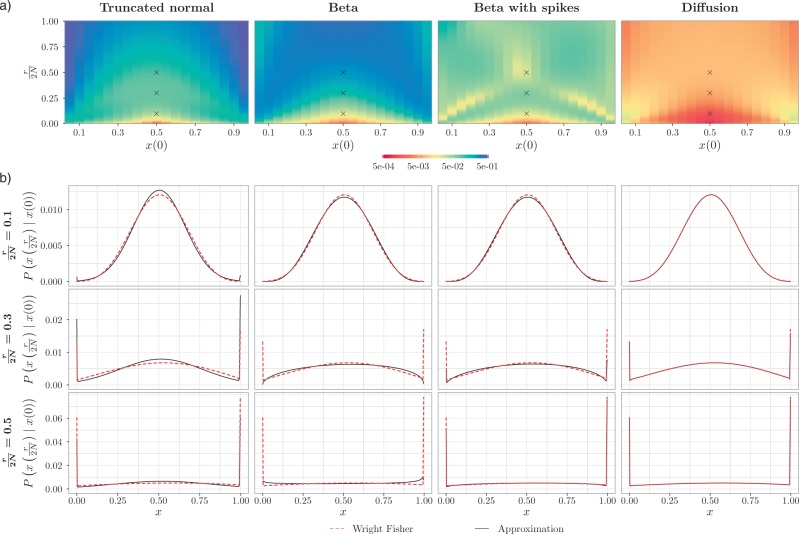
Figure 7.
Fit of various approximations to the true DAF with selection, calculated using the Markov chain property for  ,
,  ,
,  and a range of
  and
and  . Each column shows a different type of approximation, indicated at the top of the figure. a) Hellinger distance on log scale between the approximated and true DAF. The three “
 ”s in each of the heatmaps indicate the combinations of
  and
and  used in b). b) True (dashed lines) and approximated (solid lines) DAF for
  and different values of
  . Calculations are performed as for Figure 4. For comparison purposes, the a) heatmap and b)
  -axis scales are the same as in Figure 4.

