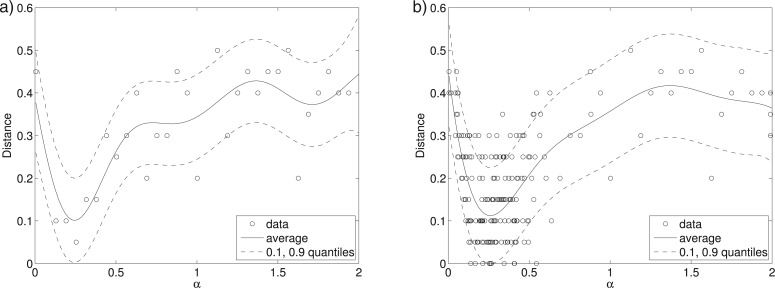
Figure 11.
The basic idea of BOLFI is to model the distance, and to prioritize regions of the parameter space where the distance tends to be small. The solid curves show the modeled average behavior of the distance  , and the dashed curves its variability for the tuberculosis example. a) After initialization (30 data points). b) After active data acquisition (200 data points).

