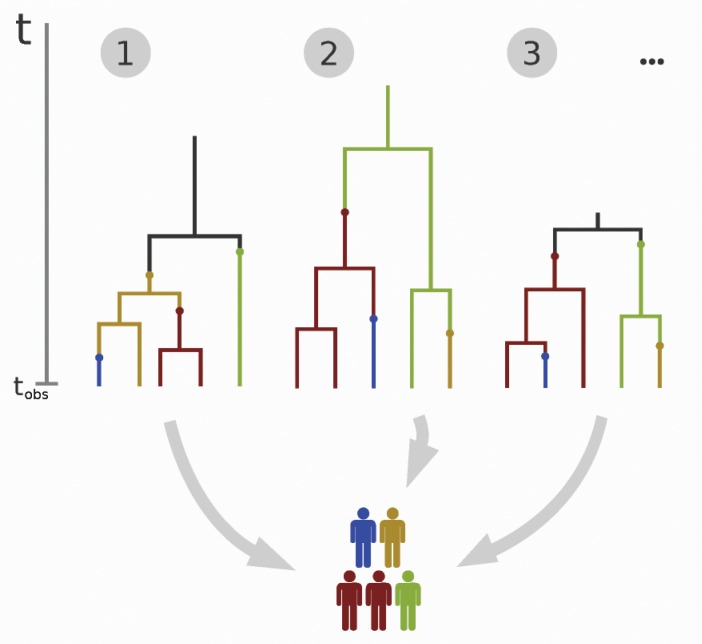
Figure 3.
The transmission process in Figure 2 can also be described with transmission trees (Stadler 2011) paired with mutations. The trees are characterized by their structure, the length of their edges, and the mutations on the edges (marked with small circles that change the color of the edge, where colors represent the different haplotypes of the pathogen). The figure shows three examples of different trees that yield the same observed data at the observation time  . Calculating the likelihood of a parameter value requires summing over all possible trees yielding the observed data, which is computationally impossible when the sample size is large.

