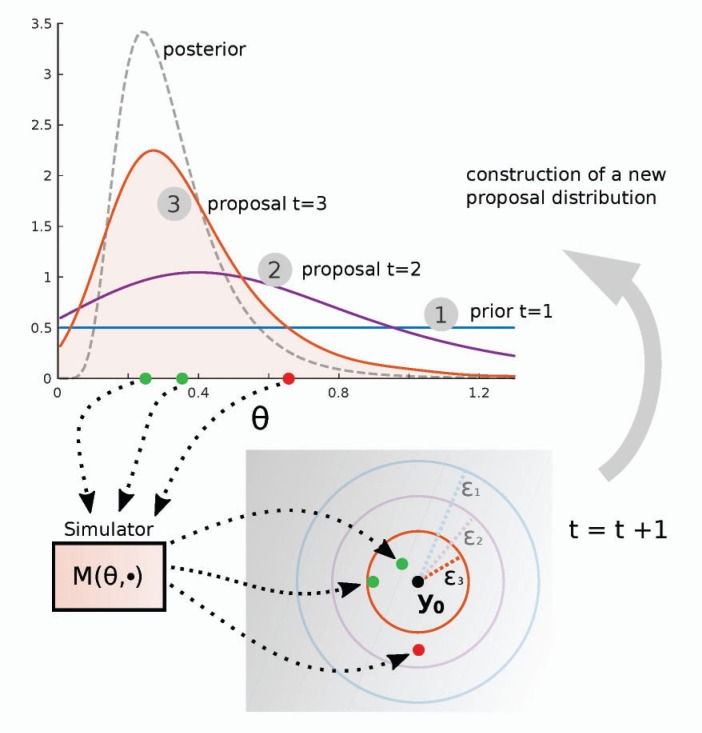
Figure 8.
Illustration of sequential Monte Carlo ABC using the tuberculosis example. The first proposal distribution is the prior and the threshold value used is  . The proposal distribution in iteration
  is based on the sample of size
  from the previous iteration. The threshold value
  is decreased at every iteration as the proposal distributions become similar to the true posterior. The figure shows parameters drawn from the proposal distribution of the third iteration (
 ). The red proposal is rejected because the corresponding simulation outcome is too far from the observed data
  . At iteration
  , however, it would have been accepted. After iteration
  , the accepted parameter values follow the approximate posterior
  . As long as the threshold values
  decrease, the approximation becomes more accurate at each iteration.

