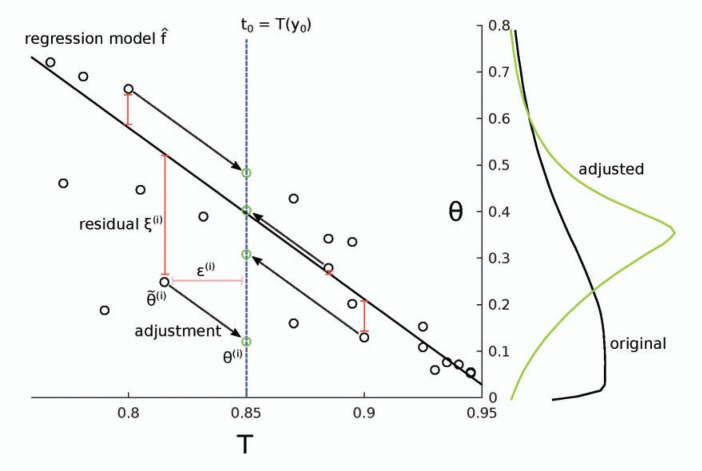
Figure 9.
Illustration of the linear regression adjustment (Beaumont et al. 2002). First, the regression model  is learned and then, based on
  , the simulations are adjusted as if they were sampled from
  with
with  . Note that the residuals
  are preserved. The change in the posterior densities after the adjustment is shown on the right. Here, the black (original) and green (adjusted) curves are the same as in Figure 10(b).

