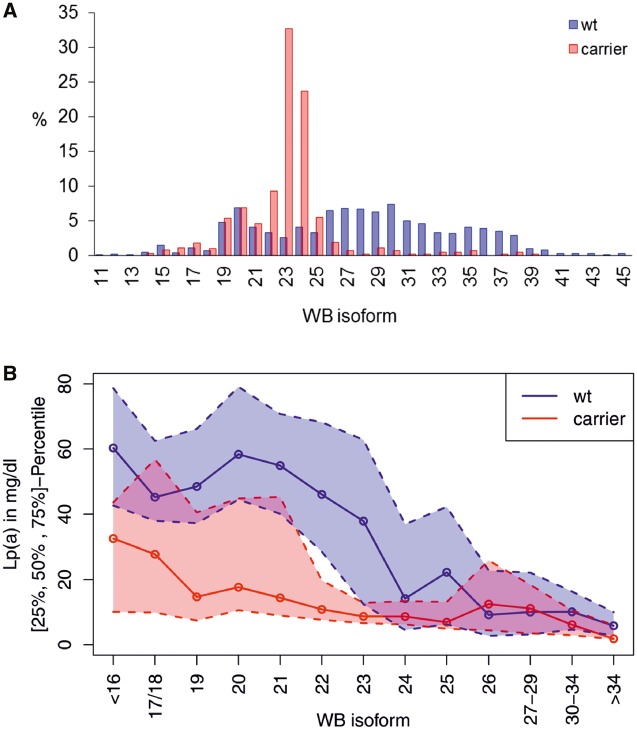
Figure 3.
Distribution and effects of G4925A. (A) Carrier frequency in the single isoform groups (based on the smaller isoform). The values report the percentage of wild type (wt), respectively G4925A carriers that present the mentioned isoform. The variant clusters in isoforms ≈19–25, peaking at 23 and 24 (32.7% and 23.7% of all carriers). (B) Median Lp(a) concentrations depending on isoform and carrier status (solid line). The variant is associated with lower Lp(a) concentrations throughout the whole isoforms range with the most pronounced effect in LMW carriers (defined ≤22 KIV repeats). Dotted lines: 1st and 3rd quartile. Isoform was binned to encompass ≥10 carrier per group (except for isoforms >34, n = 9). WB: Western blot.

